Chapter: 12th Statistics : Chapter 6 : Index Numbers
Weighted Index Numbers
METHODS OF CONSTRUCTING INDEX NUMBERS
Different types of index number (price/quantity/value) can be classified as follows.

WEIGHTED INDEX NUMBERS
In computing weighted Index Numbers, the weights are assigned to
the items to bring out their economic importance. Generally quanties consumed
or value are used as weights.
Weighted index numbers are also of two types
(i) Weighted aggregative
(ii) Weighted average of price relatives
1. Weighted aggregate Index Numbers
In this method price of each commodity is weighted by the quantity
sale either in the base year or in the current year. There are various methods
of assigning weights and thus there are many methods of constructing index
numbers. Some of the important formulae used under this methods are
a) Laspeyre’s Index (P01L)
b) Paasche’s Index (P01P)
c) Dorbish and Bowley’s Index (P01DB)
d) Fisher’s Ideal Index (P01F)
e) Marshall-Edgeworth Index (P01Em)
f) Kelly’s Index (P01K)
a. Laspeyre’s method
The base period quantities are taken as weights. The Index is

b. Paasche’s method
The current year quantities are taken as a weight. In this method,
we use continuously revised weights and thus this method is not frequently used
when the number of commodities is large. The Index is

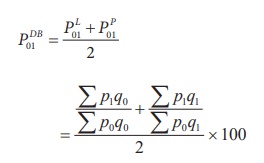
c. Dorbish and Bowley’s method
In order in take into account the impact of both the base and
current year, we make use of simple arithmetic mean of Laspeyre’s and Paasche’s
formula
The Index is
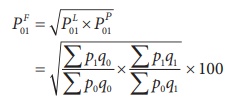
d. Fisher’s Ideal Index
It is the geometric mean of Laspeyre’s Index and Paasche’s Index,
given by:
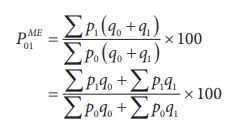
e. Marshall-Edgeworth method
In this method also both the current year as well as base year
prices and quantities are considered.
The Index is
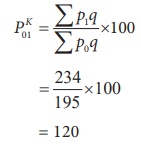
f. Kelly’s method
The Kelly’s Index is

where q refers to quantity of some period, not necessarily
of the mean of the base year and current year. It is also possible to use
average quantity of two or more years as weights. This method is known as fixed
weight aggregative index.
Example 6.6
Construct weighted aggregate index numbers of price from the
following data by applying
1. Laspeyre’s method
2. Paasche’s method
3. Dorbish and Bowley’s method
4. Fisher’s ideal method
5. Marshall-Edgeworth method

Solution:
Calculation of various indices
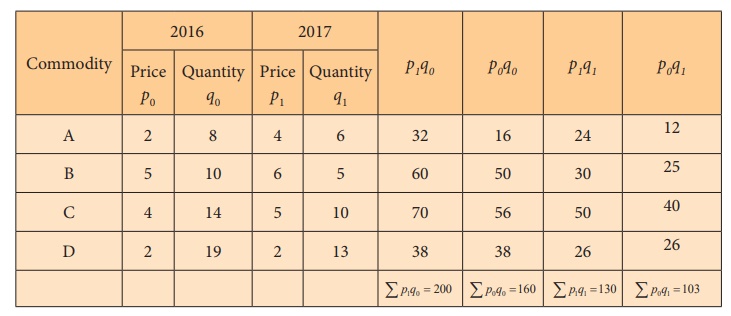
(1) Laspeyre’s Index:
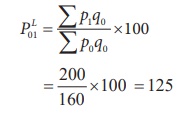
(2) Paasche’s Index

= 130 / 103 ×100 = 126.21
(3) Dorbish and Bowley’s Index

= 125.6
(4) Fisher’s Ideal Index
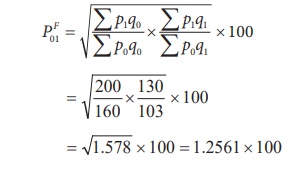
= 125.61
(5) Marshall-Edgeworth method
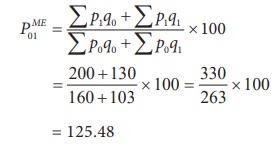
= 125.48
Example 6.7
Calculate the price indices from the following data by applying
(1) Laspeyre’s method (2) Paasche’s method and (3) Fisher ideal number by
taking 2010 as the base year.

Solution: Calculations

(1) Laspeyre’s Index
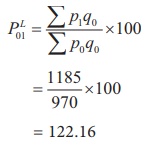
(2) Paasche’s Index
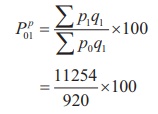
= 122.28
(3) Fisher’s Ideal Index
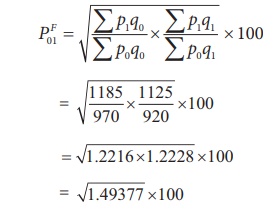
= 1.2055×100
= 120.55
Example 6.8
Calculate the Dorbish and Bowley’s price index number for the
following data taking 2014 as base year.

Solution: Price Index by Dorbish and Bowley’s Method

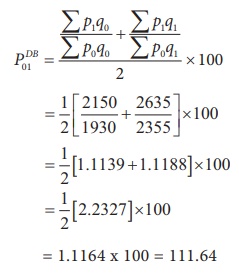
= 1.1164 x 100 = 111.64
Example 6.9
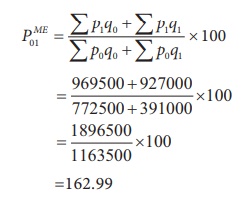
Compute Marshall – Edgeworth price index number for the following
data by taking 2016 as base year.

Solution: Price Index by Marshall-Edgeworth Method

Marshall – Edgeworth Index:
Example 6.10
Calculate a suitable price index form the following data.

Solution:
In this problem, the quantities for both current year and base
year are same. Hence, we can conlude Kelly’s Index price number.

Kelly’s price Index number:
= 120
2. Weighted average of price relatives
The weighted average of price relatives can be computed by
introducing weights into the unweighted price relatives. Here also, we may use
either arithmetic mean or the geometric mean for the purpose of averaging
weighted price relatives.
The weighted average price relatives using arithmetic mean:
If p = [p1/ p0] × 100 is the price relative
index and w = p0q0 is attached to the commodity,
then the weighed price relative index is

The weighted average price relatives using geometric mean:

Example 6.11
Compute price index for the following data by applying weighted
average of price relatives method using (i) Arithmetic mean and (ii) Geometric
mean.

Solution:
(i) Computation for the weighted average of price relatives using
arithmatic mean.
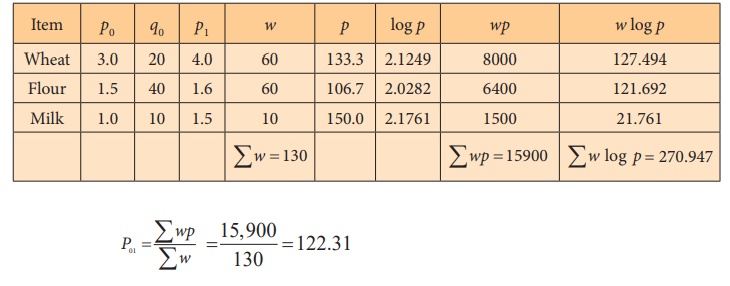
This means that there has been a 22.31 % increase in prices over
the base year.
(ii) Index number using geometric mean of price relatives is:

= Antilog (2.084) = 121.3
This means that there has been a 21.3 % increase in prices over
the base year.
3. Quantity Index Number
The quantity index number measures the changes in the level of
quantities of items consumed, or produced, or distributed during a year under
study with reference to another year known as the base year.
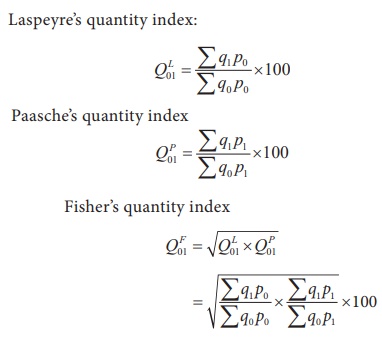
These formulae represent the quantity index in which quantities of
the different commodities are weighted by their prices.
Example 6.12
Compute the following quantity indices from the data given below:
(i) Laspeyre’s quantity index (ii) Paasche’s quantity index and
(iii) Fisher’s quantity index

Solution:
Since we are given the value and the prices, the quantity figures
can be obtained by dividing the value by the price for each of the commodities.

(i) Laspeyre’s quantity index
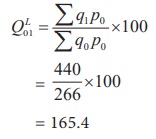
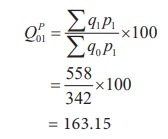
(ii) Paasche’s quantity index
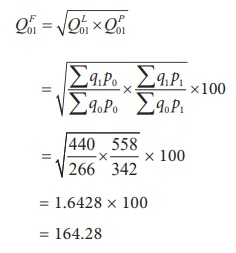
(iii) Fisher’s quantity index
4. Tests for Index numbers
Fisher has given some criteria that a good index number has to
satisfy. They are called (i) Time reversal test (ii) Factor reversal test (iii)
Circular test. Fisher has constructed in such a way that this index number
satisfies all these tests and hence it is called Fisher’s Ideal Index number.
Time reversal test
Fisher has pointed out that a formula for an index number should
maintain time consistency by working both forward and backward with respect to
time. This is called time reversal test. Fisher describes this test as follows.
“The test is that the formula for calculating an index number
should be such that it gives the same ratio between one point of comparison and
the other, no matter which of the two is taken as base or putting in another
way the index number reckoned forward should be the reciprocal of that reckoned
back ward”. A good index number shoud satisfy the time reversal test.
This statement is expressed in the form of equation as P01
× P10 = 1.
Where
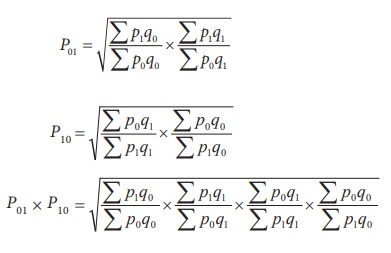
Hence, P01 × P10 = √1 = 1
Factor reversal test
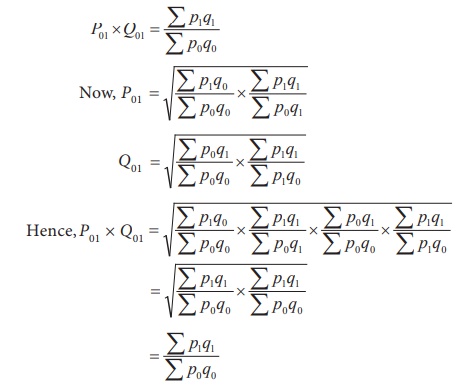
This test is also suggested by Fisher According to the factor
reversal test, the product of price index and quantity index should be equal to
the corresponding value index.
In Fisher’s words “Just as each formula should permit the
interchange of two times without giving inconsistent results so it ought to
permit interchanging the prices and quantities without giving inconsistent
results. i.e, the two results multiplied together should give the true ratio”.
This statement is expressed as follows:
Circular Test
It is an extension of time reversal test. The time reversal test
takes into account only two years. The current and base years. The circular
test would require this property to holdgood for any two years. An index number
is said to satisfy the circular test when there are three indices, P01,
P12 and P20, such that P01
× P12 × P20 = 1.
Laspeyres, Paasche’s and Fisher’s ideal index numbers do not
satisfy this test.
Example 6.13
The table below gives the prices of base year and current year of
5 commodities with their quantities. Use it to verify whether Fisher’s ideal
index satisfies time reversal test.

Solution:
Index number by Fisher’s ideal index method

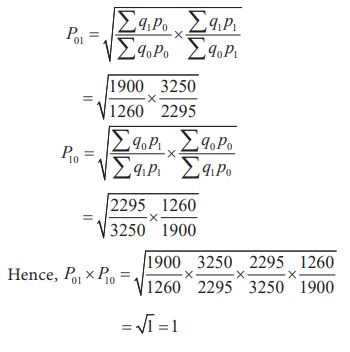
Fisher’s Index number satisties time reveral test.
Example 6.14
Calculate the price index and quantity index for the following
data by Fisher’s ideal formula and verify that it statisfies the factor
reversal test.

Solution

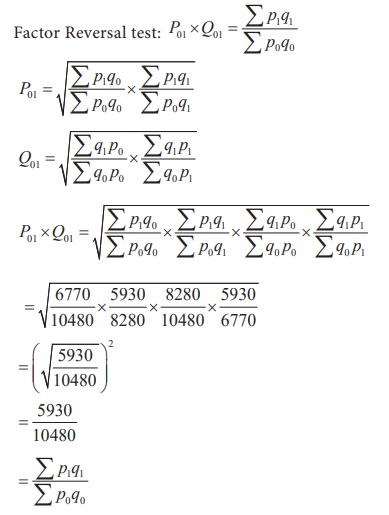
Hence, Fisher ideal index number satisfies the factor reversal
test
Related Topics