Chapter: HOURLY AND NORMAL VARIATIONS
Variations in Water Demand
VARIATIONS IN DEMAND
There are wide variations in the use of water in different seasons, in
different months of the year, in different days of the month and in different
hours of the day.
Seasonal or monthly variation are prominent in tropical countries like
India rate of consumption reaches maximum in summer season due to greater use
of water for street and lawn sprinkling etc� It goes down in winter months. The
fluctuation in the rate of consumption may be as much as 150% of the average
annual consumption.
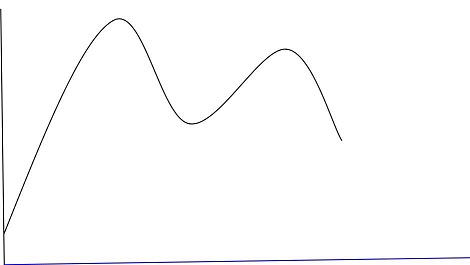
HOURLY VARIATIONS
Avg.
Demand on a maxm. Day
TIME IN
HOURS.
Daily and
hourly Fluctuations depend on the general habits of people, climatic conditions
etc� more water demand will be on Sundays and holidays due to more comfortable
working, etc�. as compared to other working days. Peak hours may be 6 a.m to
10a.m and 10a.m to 4.p.m minimum flow and between 10.p.m to 4.a.m it is very
less. The above graph shows the hourly variation in demand of water or rate of
consumption 20% of average hourly demand
ASSESSMENT OF NORMAL VARIATIONS
The maximum demands (monthly, daily or hourly) are generally expressed
as ratios of their means. The following figures are generally adopted.
1. MAXIMUM DAILY CONSUMPTION is
generally taken as 180% of the average, therefore
![]()
Maximum daily demand(MDD) = 1.8 Average daily demand (^DD)
= 1.8 q
2. MAXIMUM HOURLY CONSUMPTION is
generally taken as 150% of its average hooray
consumption of maximum day, there fore
Maximum
hourly consumption of the maximum day or
peak demand
= 1.5
(150%) x Average hourly consumption of the maxm.
Day.(Litres/day)
= 1.5 [MDD / 24 ] (Litres/hr)
= 1.5 [1.8 q / 24 ] (Litres/hr)
= 2.7 / 24 (Litres/hr)
Therfore,
Maximum
hourly consumption of the maximum day = (2.7 Annual Average hourly demand)
![]()
The
formula given by GOODRICH is also used for finding out the rather of peak
demand rates to their corresponding average values.
GOODRICH
FORMULA P=180 t 0.10
Where, P = % of annual average draft for the time�t?
in days
T = Time in days from 1/ 24 to 365
When t= 1
day (For daily variations)
P = 180 x
1 0.10
P = 180%
MDD/ADD = 180%
When t =
7 days (For weekly variations)
P = 180 x
(7)-0.10
P = 148%
MWD/ AWD = 148%
T = 30
days (For monthly variations)
![]() P = 180 (30)-0.10
P = 180 (30)-0.10
P =128%
MMD / AMD = 128%
Maxm
monthly Demand / Avg .MonthlyDemand = 128%
PROBLEMS
1.
The design population of a town is 15000 Determine
the Average daily, Maximum hourly demand under suitable assumptions
Soln: Assuming Average percapita
demand as 270 Lpcd
i.
ADD
= design population Avg. per capita
demand
= 1500 x 270 = 4050000 Litres/day
ADD = 4050 m3/day
ii.
MDD
= 1`.8 x Average daily demand
= 1.8 x 4050
= 7290 m3/day
iii.
Maximum
hourly demand of maximum day
= 2.7 x q/24
= 2.7 x (4050/24)
= 455.625 m3/hr or
= 10935 m3/day
EFFECTS OF VARIATION
1. The
sources of supplies such as wells etc� may be designed for MDD
2. The pipe
mains taking water from the source upto the service reservoirs may be designed
for MDD.
3. The
filter and OTHER UNITS at water treatment plant may also be designed for MDD.
Sometimes an additional provision for reserve is also made for break down and
repairs therefore they may be designed for twice the ADD instead of MDD.
4. The pumps
may be designed for MDD plus some additional reserve (say twice the ADD)
When the
pumps do not work for all the 24 hrs such as in small town supplies, the design
draft should be multiplied by
24/
Number of
hours in the day foe which the pumps are running
5 The distribution system is generally
designed for the maximum hourly demand of the maximum day or coincident draft
whichever is more.
6 Service reservoirs are generally designed
for 8 days consumption.
Related Topics