Chapter: Chemistry : Spectroscopy
Spectroscopy
Spectroscopy
ANALYTICAL CHEMISTRY
Analytical
chemistry is concerned with the identification of a substance, the elucidation
of its structure and quantitative analysis of its composition.
It is an
interdisciplinary branch of science which deals with various disciplines of
chemistry such as inorganic, organic, physical, industrial and biochemistry
INSTRUMENTAL METHODS
The methods
dependent upon measurement of an electrical property and those based upon
determination of the extent to which radiation is absorbed or upon assessment
of the intensity of emitted radiation, all require the use of a suitable
instrument, eg. Polarograph, spectrophotometer etc., and in consequence such
methods are referred to as instrumental methods.
The growth
of instrumental methods (or) analysis is related to the developments in the
field of electronics, so instrumental methods of chemical analysis have become
the backbone of experimental chemistry.
ANALYTICAL TECHNIQUES
–SPECTROSCOPY
Spectroscopy
is the branch of science dealing with the study of interaction of
electromagnetic radiation with matter.
It is a
powerful tool available for the study of atomic and molecular structure and it
is also used in the analysis of most of the samples.
Types of Spectroscopy:-
The study of spectroscopy is divided into two types. They are,
1. Atomic spectroscopy
2. Molecular spectroscopy.
Atomic Spectroscopy
It deals with the interactions of electromagnetic radiation with
atoms.
Molecular Spectroscopy
It deals with the interaction of electromagnetic radiation with
molecules.
Differences between atomic spectra and molecular spectra
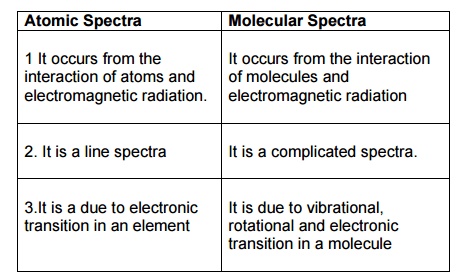
Atomic
Spectra
1.
It occurs from the interaction of atoms and electromagnetic radiation.
2.
It is a line spectra
3.It
is a due to electronic transition in an element
Molecular
Spectra
1.
It occurs from the interaction of molecules and electromagnetic radiation
2.
It is a complicated spectra.
3.
It is due to vibrational, rotational and electronic transition in a molecule
Electromangnetic radiation (or) Electromagnetic energy (or)
Radiant energy
Electromagnetic radiation is
produced due to the interaction between the electric field and the magnetic
field.
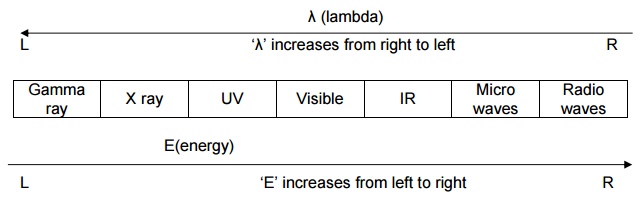
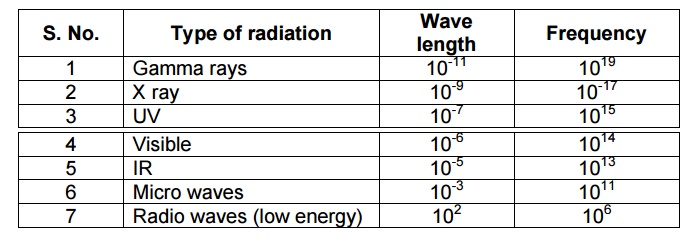
Electromagnetic radiation is divided into number of regions
according to their wave length.
It can be represented as,
λ (lambda)
Wave length (λ)
It is the distance between two successive crests of a wave.
It is denoted by ‘λ’. Wave length is express lengths nanometer
(nm,10-9m), picometer (pm,10-12m) or ‘non SI’ Units
Angstrom (Ao,10-10m)
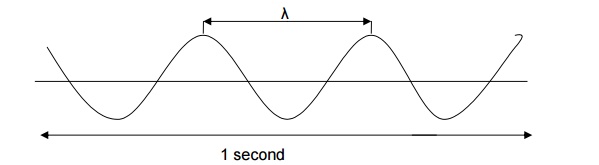
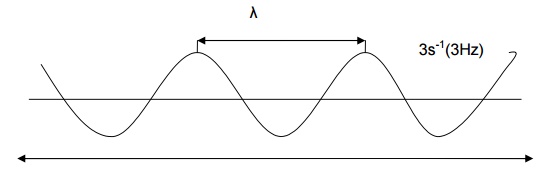
Frequency (ע)
It is the number of waves crossing a
point in unit time. It is denoted by, ע
Frequency is expressed in s-1(or) Hertz, (Hz).
Velocity of light ( c )
The product of the wavelength and the frequency is a constant
called the velocity of light (or) speed of light. That is,
C = λ
Where,
c - speed of light;
ע- frequency;
λ- wave
length
c = 2.998 X 10⁸ ms-1
c = 3 X 10⁸ ms-1
Wave number (Bar ע - ![]() )
)
It is the reciprocal of the wave length. It is denoted by ![]()
Wave number is expressed in units of per centimeter,
Electromagnetic spectrum
(EMS)
The arrangement of all types of electromagnetic radiations in the
increasing order of their wavelength or decreasing order of their frequency is
known as ‘Electromagnetic Spectrum’.
PRINCIPLE OF ATOMIC SPECTROSCOPY
Spectrum
When a beam
of polychromatic light is passed through a prism or grating it splits up into
seven different colour. The set of colours thus obtained is called a spectrum.
The complete spectrum may
extend from gamma rays of wave length 10-13 m to radiowaves of
wavelength 105m.
Classification of spectra
There are two main classes of spectra namely,
1. Absorption Spectrum.
2. Emission Spectrum.
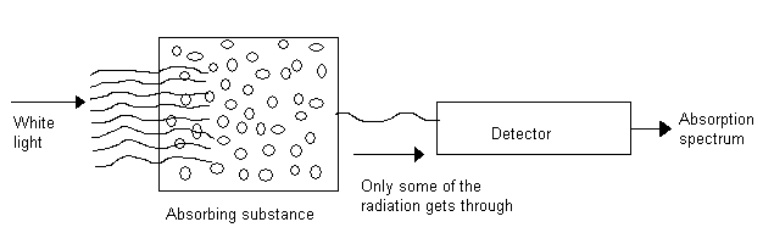
Absorption spectrum
When white light (ie.having all the wave length) is passed through
an absorbing substance and then observed through a spectroscope, it is found
that certain colours (or) wave lengths are missing and dark lines appear at
their places. The specrtrum so obtained is called absorption spectrum.
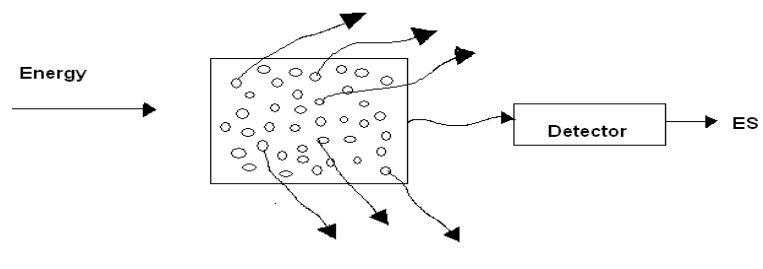
Emission spectrum
When the light emitted by a substance is passed through a prism
and examined directly with a spectroscope, the spectra obtained is referred to
as emission spectrum.
Absorption Laws
There are two laws which govern the absorption of light by the
molecules.
These are,
1. Lambert’s law
2. Beer’s law.
Lambert’s Law
When a beam
of monochromatic light is passed through a solution of an absorbing substance,
the rate of decrease of intensity of radiation (‘dI’) with thickness of the
absorbing solution (‘dx’) is directly proportional to the intensity of incident
radiation (I).
Mathematically, the law is expressed as,
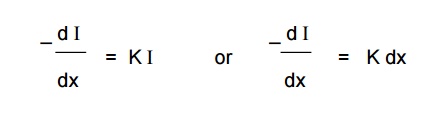
Where,
k = absorption co-efficient.
On integrating the above expression between the limits,
I = Io at x = 0
and I = I at x = l
We get
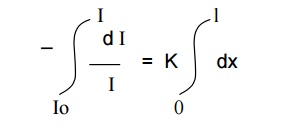
-ln I/ Io = Kl
ln Io/ I = Kl
Kl = ln Io/ I
By taking natural logarithm,
Kl
= 2.303 log Io / I
Beer’s Law
When a beam
of monochromatic light is passed through a solution of an absorbing substance,
the rate of decrease of intensity of radiation (‘dI’ ) with thickness of
absorbing solution (‘dx’) is directly proportional to the intensity of incident
radiation (I), as well as concentration of the solution( c).
Mathematically, it is expressed as
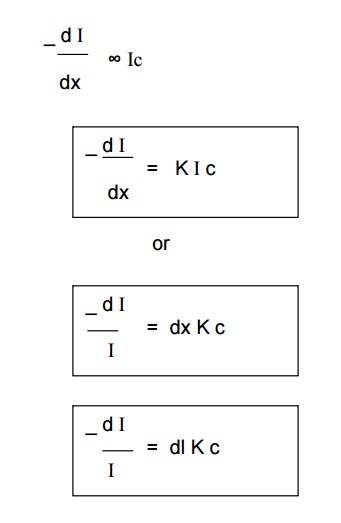
Where,
K = Absorption co-efficient.
On integrating the above expression between the limits,
I
= Io at x = 0
I
= I at x = l
We
get,
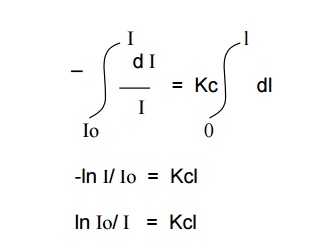
By taking natural logarithms,
2.303 log Io/ I = Kcl
log Io/ I = K / 2.303 .
cl
log Io/ I = εcl
where,
ε K=/2.303, is called the molar absorption coefficient and
log Io/ I = A, is called
the absorbance
A
= εcl
This equation is known as Beer –
Lambert’s Law
Limitations of Beer –
Lambert’s Law
This law is not obeyed if the radiation used in polychromatic.
1. It is applicable only for dilute solutions.
2. It is not applied to suspensions.
3. Deviation may occur, if the solution contains impurities.
UV – Visible Spectroscopy:
Absorption radiation in the
UV (wave length range = 200 – 400 nm) and Visible (wave length range = 400 –
750 nm) regions of the electromagnetic spectrum results transitions between
electronic levels. This is due to the larger energy change corresponds to 100 –
100,000 kJ/mol which cause simultaneous
change in vibrational and rotation energies.
E elec > E vib > E rot
Generally energy change due to electronic transition is greater
than that of vibrational and rotational transitions. Hence the UV and Visible
spectra of simple molecules exihibit narrow absorption peaks.
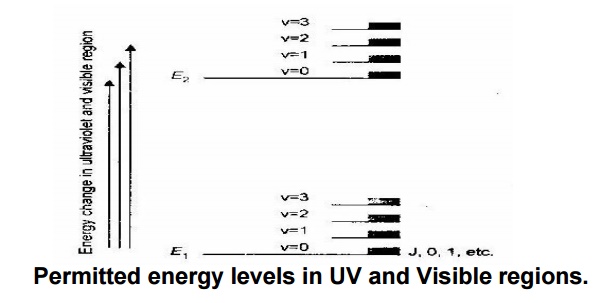
Permitted energy levels in UV and Visible regions.
The vibrational and rotational fine structure lines are not
observed during the spectrum is run in solution. This is because of the
physical interactions between sample organic molecule and the solvent molecule,
cause collisional broadening of the lines.
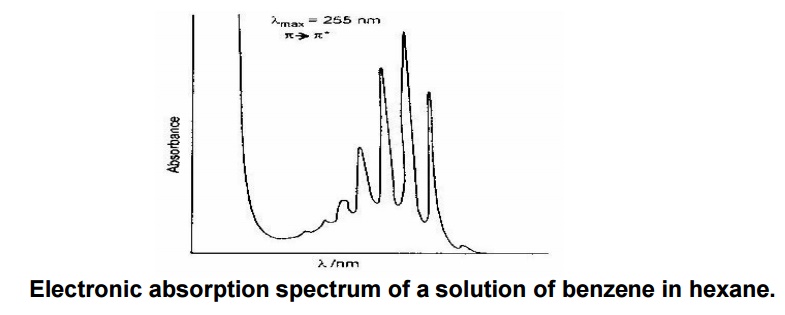
Electronic absorption spectrum of a solution of benzene in hexane.
The above spectra of benzene shows
larger peaks at 250 nm due to the presence of П electronsaks
&andtroughssmallerindicatevibrationspeofmolecules.
Types of electrons in
organic molecules involving in transitions:
1. σ electrons.
2. П electrons.
3. Non – bonding electrons.
According to Molecular orbital theory, the interaction of atomic
orbitals leads to the formation of “bonding” and “anti – bonding” molecular
orbitals. The relative energies of bonding, anti – bonding and non – bonding
molecular orbitals are given in the following diagram.
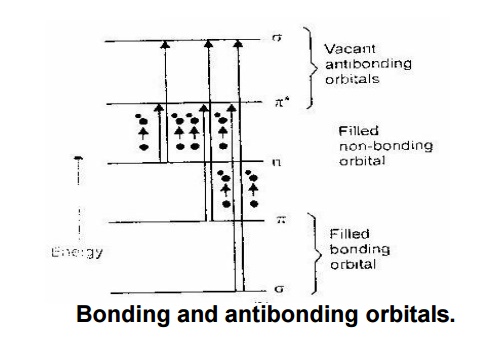
Bonding and antibonding orbitals.
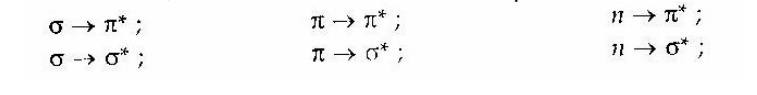
Molecules absorb radiation from UV – Visible region and undergo
various transitions. During this transition,– an bonding orbitals get excited
to vacant possible excitations, there are various transitions are possible as
follows.
These transitions are classified into
two types as follows:
1.Allowed transition:

2.Forbidden
transition:

The order
of transition is

Out of the above possible transitions,
the last three ones account for the absorption in 200
– 800 nm region of electromagnetic
radiation and first three transitions requires much higher energy, thus the
molecules characteristic spectra in the region 200 – 800 nm of electromagnetic
region.
Chromophores:
The
structural units of the compound having n or selective wavelength of UV –
Visible radiation are called chromophores.
Example: - N=N- , C=C, C=O, etc.
Auxochromes:
The polar
groups with lone pair of electrons support the intensity of chromophores are
called auxochromes.
Example: ..
-O – H , -
O – R , etc.
..
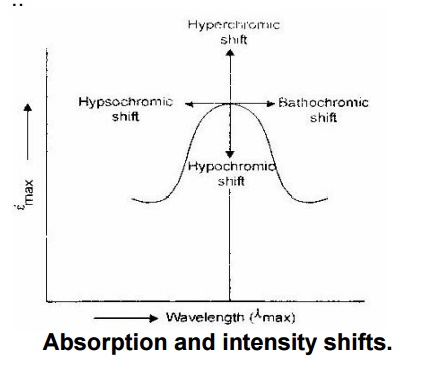
Absorption and intensity shifts.
Bathochromic shift:
It is also called red shift.
The substitution of a selective group in a molecule makes the absorption to
longer wavelength is called bathochromic shift. Example: Alkyl
substitution on olefins.
Hypsochromic shift:
It is also called blue
shift. The substitution of a selective group in a molecule make the absorption
to shorter wavelength is called hypsochromic shift. Example: Chlorine
substitution on olefins.
Hyperchromic effect:
The
substitution of a selective group in a molecule causes increase in the
intensity of absorption maximum of the molecule, and then the effect is called
hyperchromic effect. Example: Methyl substitution on benzene.
Hypochromic effect:
The
substitution of a selective group in a molecule causes decrease in the
intensity of absorption maximum of the molecule, and then the effect is called
hypochromic effect. Example: Chlorine substitution on benzene.
UV – Visible
Spectrophotometer:
Instrumentation:
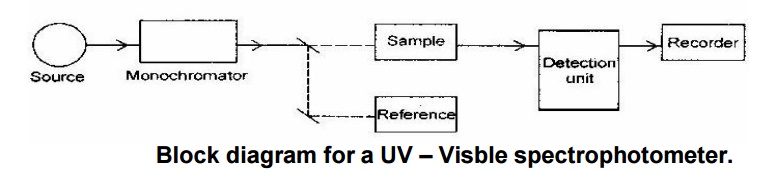
Block diagram for a UV – Visble spectrophotometer.
Components:
Radiation source:
Hydrogen or deuterium lamps
are used. It provides stable, continuous and sufficient intensity.
Filter:
It is also called monochromator. It permits the radiation of
required wavelength
only.
Cell:
It is a
transparent and uniformly constructed container which contains either sample
solution or reference solvent.
Detectors:
It converts the absorbed
radiation into current. There are three types of detectors, viz., Barrier layer
cell, photo multiplier tube and photo cell.
Recorder: It converts the signal reaches to itself into spectrum of a
molecule.
Working:
The
radiation from the source is passed through the monochromator where it splitted
into two equal beams, one half is passed into the sample cell and another half
is passed into the reference cell containing solvent. The detector will measure
the comparison of intensities of beam of light. If the sample absorbs light
then the intensity of sample beam is less than the intensity of reference beam.
It will be recorded as a signal in recorder. The instruments gives output graph
(absorption spectrum) of a plot of the wavelength verses absorbance (A) of the
light at each wavelength, where A = log (I0/I).
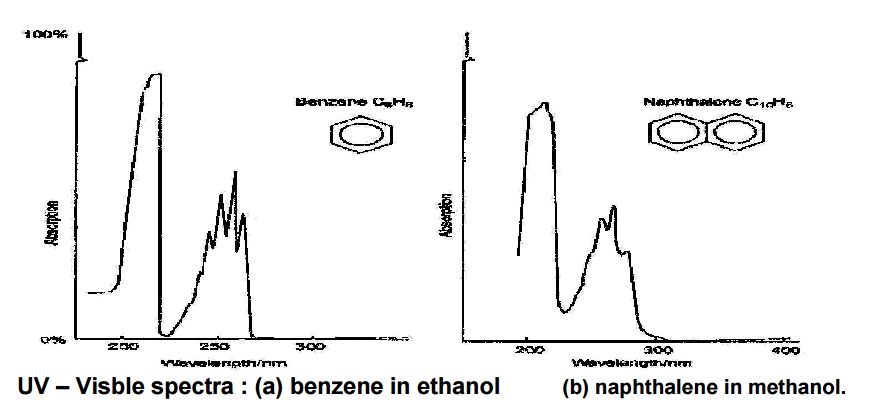
UV – Visble spectra : (a)
benzene in ethanol (b) naphthalene in methanol.
Applications of UV
spectroscopy:
1. It is used to determine the structure of vitamins, detecting
steric hindrance, study rates of reactions and determine the dissociation
constants of acids and bases from the change of absorption spectra with pH.
2. It is used to determine the dissociation energy of a molecule
accurately from the wavelength.
3. It provides the information regarding moment of inertia,
vibrational frequency and interatomic distances of diatomic molecules.
4. It is used to identify the cis and trans isomers of a compound
from absorption spectra.
5. It is used to know the purity of a compound.
6. It is used to determine the structure of organic compounds. For
example, isatin can be assigned following two possible structures:
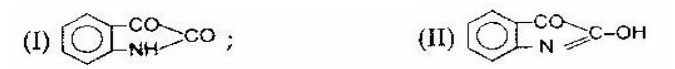
However,
the corresponding structures of two possible methyl ethers are known to us.
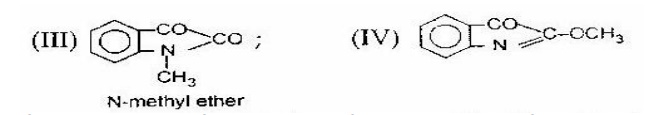
On comparison of the spectra of isatin
with that of two methyl isomers (III) and (IV), the spectrum of isatin is
similar to that of N-methyl ether (III). Hence isatin is assigned the structure
(I).
It is used
in quantitative analysis to determine the concentration of unknown sample by
using Beer – Lambert’s equation, A = E c l.
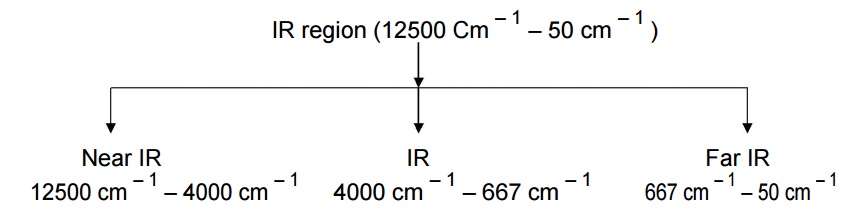
IR spectroscopy:
The spectra
of a molecule arised in IR region (12500 cm – 1 – 50 cm – 1
) due to the absorption of energy and transition occurs between different
vibrational levels. Hence it is called vibration spectroscopy.
All types
of molecules cannot interact with IR radiation. Only those molecules which
exhibit change in dipole moment during a vibration can exhibit IR spectra.
Evidently,
the homo-nuclear diatomic molecules like H2, O2, N2,
Cl2, etc do not show change in dipole moment during vibration.
Consequently, these do not exhibit IR
spectra.
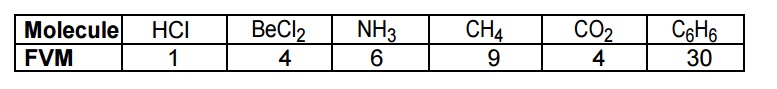
The hetero- nuclear diatomic / polyatomic molecules like HCl, BeCl2,
NH3, CH4, CO2, C6H6, etc
shows change in dipole moment and thus they exhibit IR spectra.
The IR
spectral region at 1400 cm – 1 – 700 cm – 1 gives rich,
intense and clear absorption bands for all functional groups in the organic
compounds. This region is called finger – print region. It is used to
identify the functional group present in the organic compound, Identify
the molecule and find out the characteristics of the molecule.
The IR
spectral region at 4000 cm – 1 – 600 cm – 1 gives intense
absorption bands associated with bending and stretching vibrations of
particular functional group in organic compounds. This region is called group
frequency region. It is used to identify the types of functional groups
present in organic molecules.
The molecules have certain number of
vibrational modes. It can be calculated using the following formulae.
(a)For a linear molecule, No of
fundamental vibrational mode = 3n – 5
(b)For a non
– linear molecule, No of fundamental vibrational mode = 3n – 6 where
n = number of atoms in a molecule.
Stretching and bending
vibrations in water molecule:
Water
molecule has non – linear structure. It has three fundamental vibrational modes
which are corresponding to the frequencies 3652 cm – 1 (Symmetric
stretching vibration), 3756 cm – 1 (Asymmetric stretching vibration)
and 1596 cm – 1 (Bending vibration) respectively.
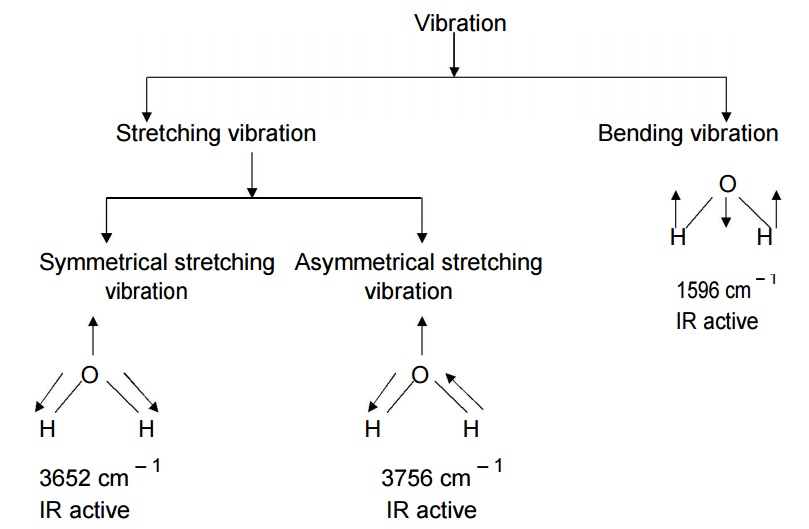
Generally
stretching frequency is greater than bending frequency, because more energy is
required to stretch the bond than to bend. All the above three vibrations are
IR active and giving IR spectra at various frequencies. Hence IR active
molecule undergoes change in dipole moments.
Stretching and bending
vibrations in water molecule:
Carbon dioxide molecule has linear structure. It has four fundamental vibrational modes which are corresponding to the frequencies 1340 cm – 1 (Symmetric stretching vibration), 2350 cm – 1 (Asymmetric stretching vibration) and twice 666 cm – 1 (In plane bending vibration and Out of plane bending vibration) respectively.
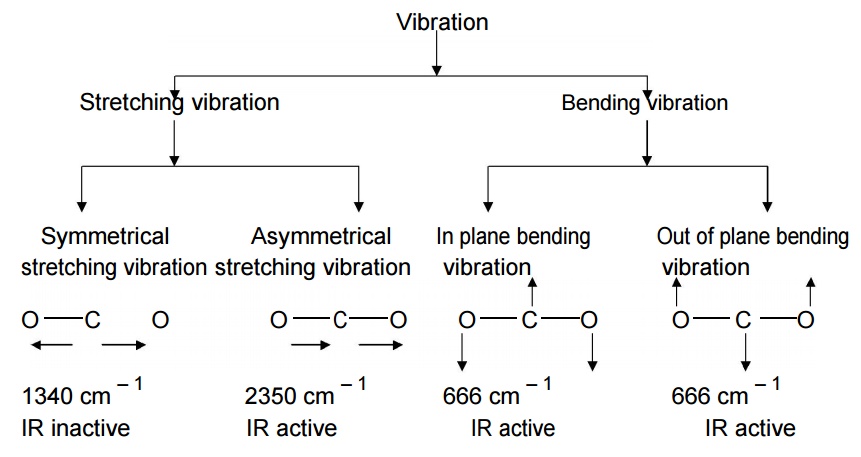
In symmetrical stretching, both bonds
are shortened or elongated to the same extent. Hence there is no change in
dipole moment. So it is IR inactive.
In asymmetrical stretching, one of the
bonds is shortened and the other is elongated. Hence there is change in bond
length and dipole moment. So it is IR active.
In bending,
both in-plane and out of plane bending involves variation of bond angle. Hence
there is change in bond angle and dipole moment. So it is IR active.
Even we have three active vibrations at 2350 cm – 1, 666 cm –
1 and 666 cm – 1 respectively, we get two absorption band
only, One at 2350 cm – 1 and another one at 666 cm – 1.
Instrumentation:
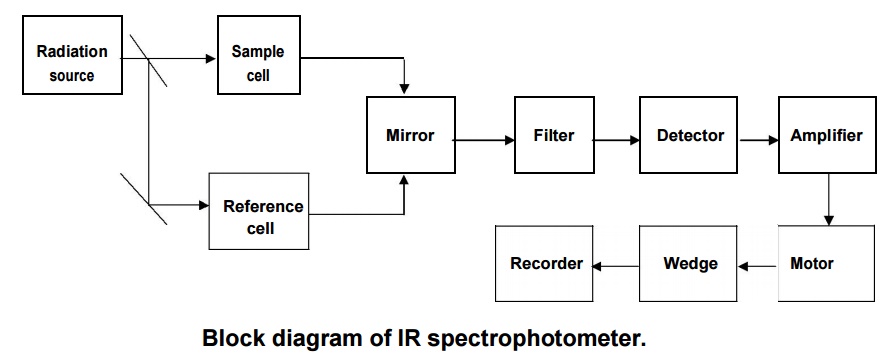
Block
diagram of IR spectrophotometer.
Components:
Radiation source:
The Nernst
glower (Oxides of Zr, Y and Er) is heated to 1500oC to give IR
radiation, which is used as radiation source.
Optical prism: It is also called mirror, which is used to reflect the radiation
on filter.
Filter:
It is also
called monochromator, which sent the individual frequencies to the detector.
Amplifier: It amplifies the current received from the detector. Motor: It
drives the wedge.
Recorder: It draws the IR spectrum, based on the movement of wedge.
Working:
The IR
radiation from radiation source is splitted into two equal half beams; one half
is passed into the sample cell and another half is passed into the reference
cell containing solvent respectively. Then these beams are fall on the mirror
and reflected to the monochromator, where the selective radiation is sent to
the detector. The radiation received by the detector is converted into current.
It is amplified and coupled to the motor which drives a wedge. Based on the
movement of the wedge the recorder draws the absorption bands on the chart.
Finally, we get a spectrum as a graph of Transmittance verses wave number from
the IR spectrophotometer.
Applications:
1. It is used to identify the presence of functional groups in
organic compounds. For example, IR spectra of both benzaldehyde and
acetophenone shows absorption peak at 1700 cm – 1. This indicates
that the presence of keto group (C=O) in both the compounds.
2. It is used to detect the presence of impurities in organic
compounds, by comparing the IR spectra of the pure (shows actual absorption
bands) and impure (shows extra absorption bands) compounds.
3. It is used to distinguish inter and intra molecular hydrogen
bonding in organic compounds.
4. It is used to study the molecular symmetry, dipole moment,
structure, bond angle and bond length, etc. of various organic and inorganic
compounds.
5. It is used to distinguish positional isomers of organic compounds.
6. It is used in rapid quantitative analysis of mixture of compounds.
7. It is used to study the kinetics of a reaction