Chapter: 11th 12th std standard Indian Economy Economic status Higher secondary school College
Short run average cost curves - Average Fixed, Average variable and Average Total Cost

Short run average cost curves
Average Fixed Cost (AFC)
The average fixed cost is the fixed cost per unit of output.
It is obtained by dividing the total fixed cost by the number of units of the
commodity produced.
Symbolically AFC
= TFC / Q
Where AFC = Average fixed Cost TFC = Total Fixed cost
Q = number of units
of output produced
Suppose for a firm the total fixed cost is Rs 2000 when
output is 100 units, AFC will be Rs 2000/100 = Rs 20 and when output is 200
units, AFC will be Rs 2000/200 = Rs10/- Since total fixed cost is a constant
quantity, average fixed cost will steadily fall as output increases; when
output becomes very large, average fixed cost approaches zero.
Average
Variable cost (AVC): Average variable cost is the variable cost per unit of output. It is
the total variable cost divided by the number of units of output produced.
AVC = TVC / Q
Where AVC = Average Variable Cost
TVC = Total
Variable Cost
Q = number
of units of output produced
Average variable cost curve is 'U' Shaped. As the output
increases, the AVC will fall upto normal capacity output due to the operation
of increasing returns. But beyond the normal capacity output, the AVC will rise
due to the operation of diminishing returns.
Average
Total Cost or Average Cost : Average
total cost is simply called average
cost which is the total cost divided by the number of units of output produced.
AC = TC / Q where AC = Average Cost TC = Total Cost
Q = number of units of output produced
Average cost is the sum of average fixed cost and average
variable cost. i.e. AC = AFC+AVC
Table Calculation of Average Fixed,
Average variable and Average Total Cost
Units of TFC TVC TC AFC AVC AC
output 2 ÷ 1 3
÷ 1 5 + 6
1 2 3 4 5 6 7
0 120 0 120 - 0 -
1 120 100 220 120 100 220
2 120 160 280 60 80 140
3 120 210 330 40 70 110
4 120 240 360 30 60 90
5 120 400 520 24 80 104
6 120 540 660 20 90 110
7 120 700 820 17.14 100 117.14
8 120 880 1000 15 110 125

The average cost is also known as the unit cost since it is
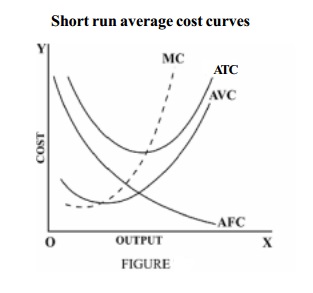
the cost per unit of output produced. The following figure shows the shape of
AFC, AVC and ATC in the short period.
From the figure , it can be understood that the behaviour of
the average total cost curve depends on the behaviour of AFC and AVC curves. In
the beginning, both AFC and AVC fall. So ATC curve falls. When AVC curve begins
rising, AFC curve falls steeply ie fall in AFC is more than the rise in AVC. So
ATC curve continues to fall. But as output increases further, there is a sharp
increase in AVC, which is more than the fall in AFC. Hence ATC curve rises
after a point. The ATC curve like AVC curve falls first, reaches the minimum
value and then rises. Hence it has taken a U shape.
Related Topics