Chapter: Engineering Economics and Financial Accounting : Production Function and Cost Anaysis
Short Run and Long Run Cost Curves
SHORT RUN AND LONG RUN COST
CURVES
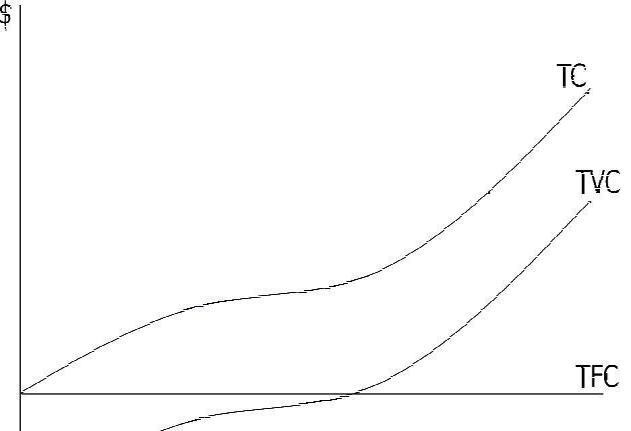
Short-run cost curves are normally based on a production function with one variable factor of production that displays first increasing and then decreasing marginal productivity. Increasing marginal productivity is associated with the negatively sloped portion of the marginal cost curve, while decreasing marginal productivity is associated with the positively sloped portion. The average fixed cost (AFC) curve is the cost of the fixed factor of production divided by the quantity of units of the output,
While the
average variable cost (AVC) curve cost traces out the per unit cost of variable
factor of production. The U-shaped average total cost (ATC) curve is derived by
adding the average fixed and variable costs. The marginal cost (MC) intersects
both the AVC and ATC curves at their minimum points. Declining average total
costs are explained as the result of spreading the fixed costs over greater
quantities and, at low quantities, the result of the increasing marginal
productivity, in addition. Increasing average costs occur when the effect of
declining marginal productivity overwhelms the effect of spreading the fixed
costs.
The
long-run cost curves, usually presented in a separate diagram, are also
expressed most commonly in their average, or per unit, form, represented here
in Figure 2. The long-run average cost (LRAC) curve is shown to be an envelope
of the short-run average cost (SRAC) curves, lying everywhere below or tangent
to the short-run curves. The firm is constrained in the shortrun in selecting
the optimal mix of factors of production and so will never be able to find a
cheaper mix than can be found in the long-run when there are no constraints.

Related Topics