Chapter: Business Science : Services Marketing : Service Design and Development
Service Quality
SERVICE
QUALITY
Service
quality is the assessment of quality is done during the service delivery
processes.
Service
Quality:
It
is an attitude formed by a long-term overall evaluation of a firm‟s
performance.
Quality:
“The
quality of service is the degree of conformance of all the relevant features
and characteristics of service to all the aspects of customer needs limited by
the price and delivery he/she will accept.”
Quality
may be judged from the following:
1)
Design reflected through the relevant
feature and characteristics of service.
2)
Satisfaction of customer needs
3)
Production and delivery of service
PRINCIPLES
OF SERVICE QUALITY:
v
S.Q is more difficult for the
consumer to evaluate than the quality of goods.
v
It is based on consumer perception.
Service
quality perception result from a comparison of what the customer expected prior
to the service and the perceived level of service received.
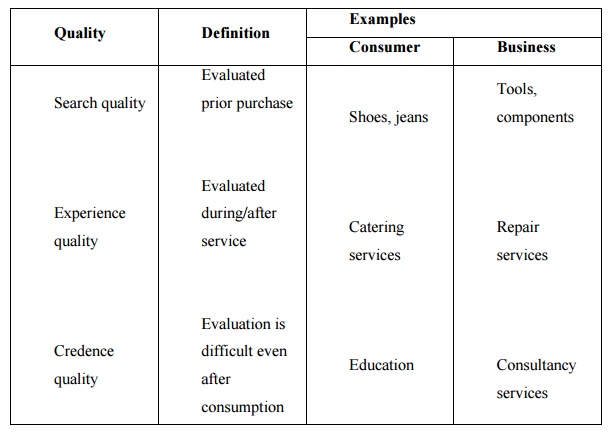
UNDERSTANDING
SERVICE AND GOODS QUALITY CHARACTERISTICS:
DIMENSIONS
OF SERVICE QUALITY
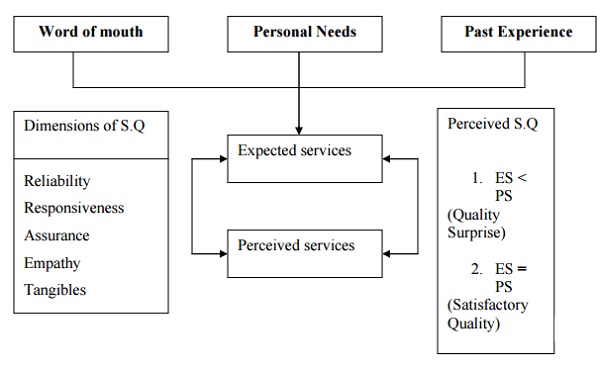
DIMENSIONS
OF SERVICE QUALITY:
1.TANGIBLES: This includes the service
provider‟s appearance of employees.
E.g.
park Sheraton, interior design, menu card, staff appearance
2.RELIABILITY: It is the ability of the
service firm to perform the service promised dependably and accurately.
E.g.
catering services
3.ASSURANCE: It refers to the knowledge and
courtesy of the employees of companies and their ability to inspire trust and
confidence in the customer mind.
E.g.
BPO service
4.EMPATHY: It is the caring individualized
attention the service firm providers to each customer. E.g. Medical service
5.RESPONSIVENESS: It is the willingness of
the firm‟shem prompt service.
E.g.
Airline service, Enquiry desk
PERSPECTIVES OF SERVICE QUALITY:
1. Transcendent View –Quality judged E.g. Medical service experience
2. Product
based View –Quality depends on each service E.g. Saloon ingredients
3. User
based View –Quality lies in the eyes of the user E.g. Education
4. Manufacturing
View –Quality based productivity E.g. BPO services
5. Value
based View –Service quality is judged in terms of value and prices E.g.
Transport services
THE
CHAIN OF CONFORMANCE:
SERVQUAL
It
means service quality. It is the instrument which is used to measure service
quality.
The instrument was based on the promise that service
quality is the difference between customer expectations and their evaluation of
the service they received.
It is a test instrument which consists of various
questions. The first part of the questionnaire asks the customer to indicate
the level of service they would expect from a firm in a particular industry.
The second part of the questionnaire asks the
customer to evaluate the service performed by a specific service firm. Service
quality is equal perceived service score –customer expectation.
This
method of determining service quality is called GAP theory.
MEASURING
AND IMPROVING SERVICE QUALITY
1.SOFT
MEASURE:
They can‟t
be easily observed
and must be
coll
SERVQUAL
can be used to measure
a.
On going surveys
b.
Employee surveys
c.
Mystery shopping
d.
Focus group discussion
2.HARD
MEASURE:
They refer to operational procedures and include
data as service response time, failures rates and delivery costs
E.g.
how many minutes a customers had to wait in line to get the service?
TOOLS
FOR ANALYSING THE SERVICE QUALITY PROBLEM
1.ROOT
CAUSE ANALYSIS. THE FISH BONE DIAGRAM
Diag1:
cause and effect chart for flight departure delays.
1.Late food service, Late fuel –materials 2.Back
stage personnel –Late cabin cleaners
3.Information
–Poor announcement of departures
4.Procedures –Delayed check in procedures,
acceptance of late passengers 5.Front stage personnel –Too few agents, agents arrive
late agents under trained. 6.Facilities –Air craft late to gate.
7.Customers –arrive late 8.Others –weather air
traffic
2.THE PARETO ANALYSIS: 80% of quality is
maintained by monitory 20% of the activities. E.g. Customer enquiry
3.BLUE
PRINTING
It
enables us to visualize the process of service delivery by depicting the
sequence of front stage enter actions that customer‟s experience.

Thus blue printing helps us to understand how
failures at one point may have multiple effects in the process of service. An
effective tool to design fail points can be done by using POKA –YOKE
4. RETURN
ON QUALITY –RETURN ON INVESTMENT
A) Assess
costs and benefits of quality initiatives.
B) Determine
the optimum level of reliability
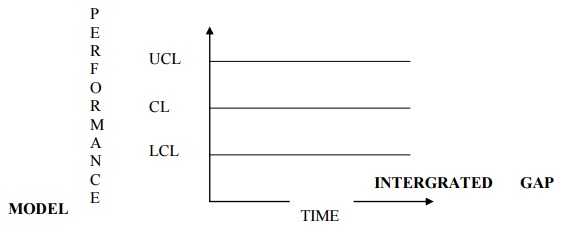
5.
CONTROL CHART:
The
quality of service is indicated by the performance indicator
6. X
chart: Monitor the average level of performance.
7. R
chart: Monitor the variability
8. P
chart: It is used when the result of service of each
customer can be either acceptable or not.
9. C
chart: It is where the quality is indicated by no. of
defects.
Diagram
1: Control chart for services.
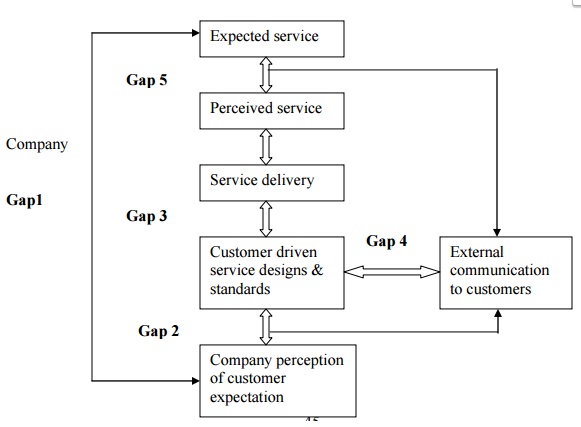
Diag1:
Gaps model of service quality
GAP
1:
Not knowing what customer expects
2. Not
selecting right customer design & standards
3. Not
delivering the service standards
4. Not
matching performance with promises.
FACTORS
LEADING PROVIDER GAP 1:
Co.
perception of customer expectation
a)
Inadequate Marketing Research Orientation
Ø
Insufficient marketing research
Ø
Research not focused service
quality
Ø
Inadequate use of market research
b)
Lack of upward communication:
Ø
Lack of interaction between
management and customers
Ø
Insufficient communication between
contact employees and managers
Ø
Too many layers between contact
personnel and top management
c)
Insufficient relationship focus:
Ø
Lack of market segmentation
Ø
Focuses on transaction rather than
relationships
Ø
Focuses on new customers rather
than existing customers
d)
Inadequate service recovery:
STRATEGIES
TO REDUCE GAP1:
The
emphasis on acquiring new customers should be changed in order to retain the
old customers.
GAP
2:
Three
factors leading to provider gap 2
Customer
driven service design and standards.
a)
Poor service design:
Unsystematic
new service development process
è
Undefined service design
è
Failure to connect service design
to service positioning
b)
Absence of customer defined standards:
è
Absence of process management to
focus on customer requirement
è
Absence of formal process for
getting service quality goals.
c)
Inappropriate physical evidence and service scale:
è
Management perception of customer
expectation
HOW
TO REDUCE GAP 2:
1. Design
clearly without over simplification, incompleteness and subjectivity.
2. Develop
effective strategies for new service and use service ability as an implication
tool.
3. Develop
customer defined service standards
4. Design
physical evidence to meet customer expectation.
PROVIDER
GAP 3:
This is the discrepancy between development of
customer driven standards and actual service performance by company employees.
REASONS
LEADING TO PROVIDER GAP 3:
a)
Deficiency in HR policies:
«
Ambiguity and role conflicts
«
Inappropriate evaluation and
compensation system
«
Lack of empowerment perceived
control and team work
b)
Failure to match supply and demand:
«
Inappropriate customer mix
«
Over lies on price
«
Failures to smooth peaks and
barriers
c)
Customers are not fulfilling:
Customer‟s ignorance
of responsibilities
«
Customers negatively affect each
other
«
Problems with service
intermediaries
«
Channel conflict
«
Difficulty in controlling quality
and consistency
«
Tension between empowerment and
control
STRATEGIES
TO REDUCE GAP 3:
Ensure
that all the resources is needed to achieve standards are in place
PROVIDER
GAP 4:
This
is the difference between service delivery and
service provider‟s exter
REASONS:
service delivery
a)
Lack of integrated service marketing communication:
√Not
including interactive marketing plans
√Absence
of strong marketing program
√Tendency
to view each external communication as independent
b)
Ineffective management of customer expectation:
√Not
managing the customer expectation in communication
c) Over
promising through advertisements
d) Inadequate
horizontal communication:
√Differences
in policies and procedures across the branches
√Insufficient
communication between advertising and operation
STRATEGIES
TO REDUCE GAP 4:
Improved
service delivery through communication
Related Topics