Information Processing | Term 3 Chapter 6 | 2nd Maths - Representation of data and drawing inferences | 2nd Maths : Term 3 Unit 6 : Information Processing
Chapter: 2nd Maths : Term 3 Unit 6 : Information Processing
Representation of data and drawing inferences
UNIT 6
Information Processing

Representation of data and drawing inferences
Travel Through
Keywords: Categorise, Information, Data, Record
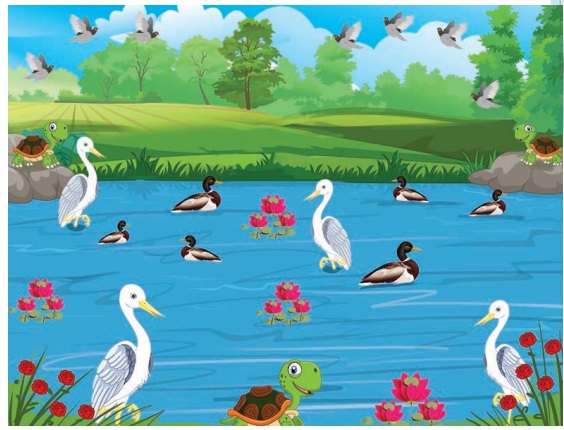
Observe the living creatures seen in the pond. categorise and record them.
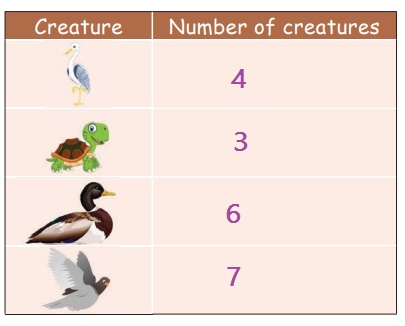
1. Tick / underline the bird found in more number. - crane / duck
2. Tick the creature found in less number. - turtle / dove
3. Tick the bird found in less number. - dove / duck
4. duck is seen in large number in the pond.
5. Among all the living creatures, the least found in the pond is turtle .
Learn
Tally marks
Tally marks are lines which represent the number as follows

Arivu, the farmer records the number of animals that are seen inside the fence using tally marks.
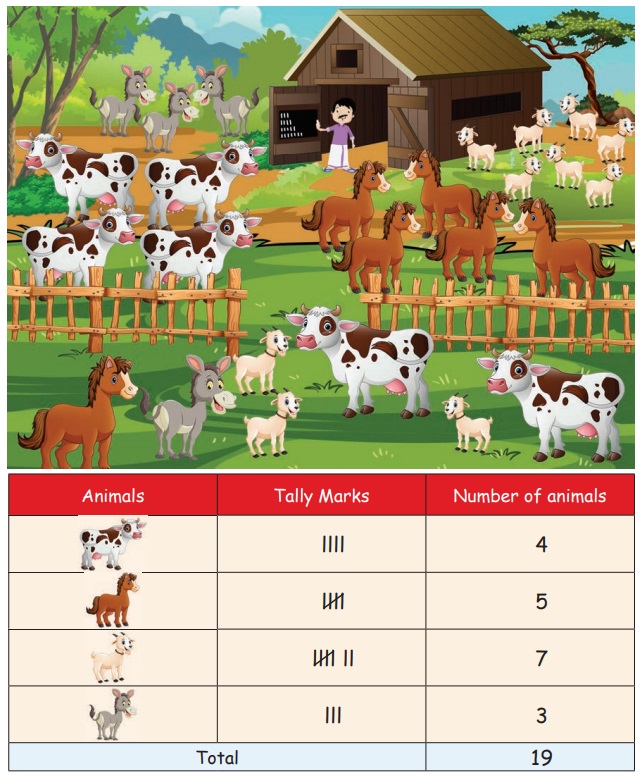
Teacher’s Note: Teacher can encourage the students to first draw the tally marks and then count the number of tally marks drawn.
Practice
What is my height?
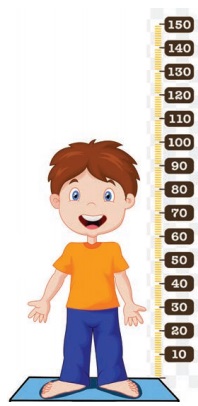
Form groups as per the strength of the class. Collect the information from your friends and complete the table.
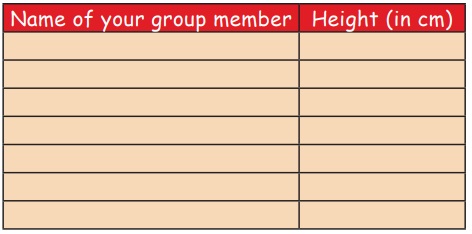
From the above table, fill in the data using tally marks.

Try This
Divide the class into groups as per the strength of the class. Record their blood group in the table given below using tally marks.

From the table, answer the following questions.
1. Which blood group is the most common among the groups?
2. Which is the least found blood group among the groups?
3. O− is the universal donor. The maximum number of chance that the O− can donate to is ------------
Teacher’s Note: Teacher can tell children that any blood cannot be used by other. Also tell them that +ve is different from -ve. To donate the blood, same group of blood should be used. O− can be donated to any other group. AB+ can accept any other blood group.
Related Topics