Chapter: Introduction to Botany: Introduction
Methods of Taxonomy and Diagnostics
Methods of Taxonomy and Diagnostics
The goal of taxonomy is to describe diversity, provide an insight to the evolution-ary history (phylogeny), help to determine organisms (diagnostics) and allow fortaxonomic estimations. The latter means that if we know features of one plant, the taxonomically close one should have similar features. For example, plants from cabbage family (Cruciferae) contain mustard oil (which is responsi-ble for the horseradish taste of many of them). DNA analysis shows that papaya (Carica from Moringaceae family) is taxonomically close to Cruciferae. We may guess that papaya also have mustard oil, and this is true! Papaya seeds have the prominent horseradish taste.
One of the oldest methods of taxonomy is expert-based. Experts produce clas-sifications based of their exclusive knowledge about groups. First taxonomic expert was Carolus Linnaeus (XVIII century). Experts use a variety of meth-ods, including phenetics, cladistics (see below), general evolutionary approach, their ability to reshape available information and their intuition. Their goal is to create the “mind model” of diversity and then convert it to classification, using neighbor groups as a reference (for example, to assign ranks).
Cladistics
The more contemporary, much more formalized than expert-based is cladistics фззкщфср. Below, cladistic procedure is explained using artificial example of three organisms. The goal of the analysis is the creation of a phylogeny tree (cladogram) which becomes the basis of classification. Below is a short instruc-tion which explains the basics of the cladistic analysis on the artificial example of several “families” of plants.
1. Start with determining the “players”—all subtaxa from bigger group. In our case, it will be these three “families”:
Alphaceae
Betaceae
Gammaceae
2. Describe these three groups:
Alphaceae: Flowers red, petioles short, leaves whole, spines absent
Betaceae: Flowers red, petioles long, leaves whole, spines absent
Gammaceae: Flowers green, petioles short, leaves dissected, spines present
3. Determine individual characters (we will need at least 2N + 1 characters where N is number of studied taxa):
(1) Flower color
(2) Petiole size
(3) Dissection of leaves
(4) Presence of spines
4. Polarize the characters: every character should have at least two charac-ter states where “0” is ancestral, plesiomorphic state, and “1” is derived, apomorphic state. To decide which state is plesiomorphic and which isapomorphic, use these kinds of arguments:
(a) Historical evidence (e.g., from fossils)
(b) Developmental evidence
(c) Comparative evidence
5. If this information is absent, find the outgroup which is the most ances-tral, most early divergent taxon related to our groups. In our case, we will employ outgroup:
Omegaceae: Flowers green, petioles short, leaves whole, spines absent.
6. Label characters with “1” (apomorphic) or “0” (plesiomorphic):
(1) Flower color green—0; red—1
(2) Petiole size small—0; big—1
(3) Dissection of leaves absent—0; present—1
(4) Absence of spines—0; spines present—1
7. Make character table containing both subtaxa and labeled characters:
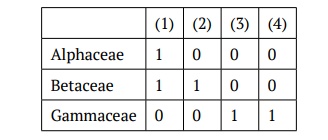
(Outgroup, Omegaceae evidently has all zeroes.)
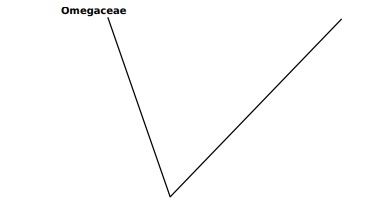
8. Start the tree from outgroup (this step is not absolutely necessary but will make phylogeny more clear):
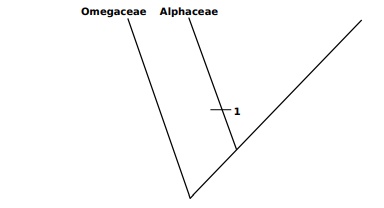
9. Most ancient ingroup (Alphaceae) is a first branch, label it with bar which shows acquisition of the advanced state of first character (red flower color):
10. Attach more and more sub-taxa. It is possible to do this randomly (like most of phylogeny software), or attach groups to make shortest tree. For example, Betaceae and Gammaceae have equal number of synapomorphies but Betaceae have only one character different from Alphaceae it is sensi-ble to attach it first, and then attach Gammaceae:
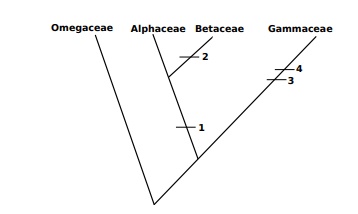
This tree has 4 evolutionary events (length = 4)
11. If Gammaceae was attached first, then resulted tree will be be one step longer:
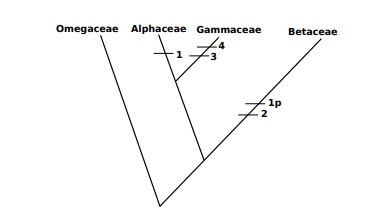
There are five evolutionary events; in other words, length of tree = 5. (“p” are parallel characters (homoplasies); there might be also reversals (“r”), when apomorphic character disappears).
There could be also tree with length = 6, or even more if tree includes character reversals, but all of them will be longer than the first one.
12. Choose the shortest, most parsimonous tree. Second tree has 5 events, first tree has 4 events, others could be only longer. Consequently, we choose the first tree. By the way, many computer programs do not fol-low the procedure above strictly and simply produce all possible trees, and finally choose the shortest.
13. Use the chosen tree as a source of classification:
Order Alphales
1. Family Alphaceae
2. Family Betaceae
Order Gammales
1. Family Gammaceae
This step is needed only if you wish to convert cladogram into traditional, classification. In fact, cladograms are rank-free and might be used as is.
Cladograms often used as source of time trees which are made with genetic information and information from fossils. If we know the age of taxonomic group, we can use it as more objective replacement of rank.
Ability to review and compare phylogenetic trees requires understanding of sev-eral basic rules, for example:
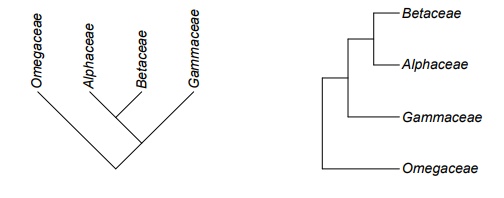
1. Tree edges may be freely rotated in any direction. For example, these trees are same:
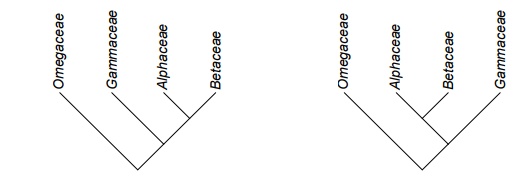
2. Direction of branches also does not matter. These trees are same:
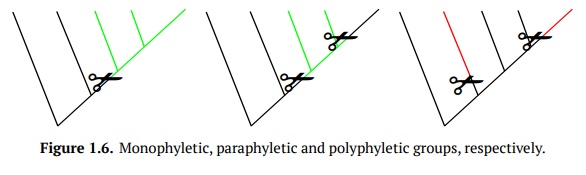
It is not always simple to make classification from a tree. On the previous exam-ple, we simply designate the whole branch as a taxon (order which contains our three families). There are situations when only middle part of the branch seems to be acceptable as a taxon. In these cases, remaining part is called paraphyletic taxon.
Paraphyletic groups include all immediate ancestors of its members but not all descendants of these ancestors. Good example of paraphyletic taxon are rep-tiles: when we take mammals and birds from amniote branch, reptiles will be what is left. Gymnosperms (all seed plants without angiosperms) is another ex-ample, but in this case somemolecular trees show that gymnosperms is also a natural branch (i.e., monophyletic group). Monophyletic groups include all im-mediate ancestors and all their descendants.
When the group contains taxa from different branches, it is polyphyletic. Poly-phyletic groups are not allowed.
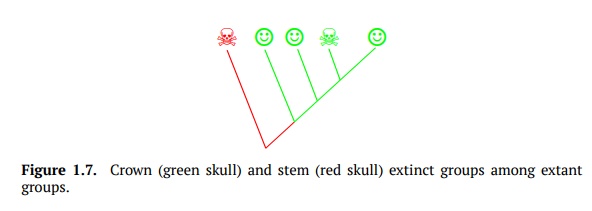
Another important distinction between groups of the phylogeny tree is stem and crown groups. All extant members together with their immediate ancestors form a crownof taxon (Fig. 1.7). If one member of crown went extinct, we can esti-mate that it was somehow similar to other crown members. In other words, if we find a way ho to re-create mammoth, we probably understand how to feed it because it belongs to the Elephantidae family crown. However, if the fossil, ex-tinct members of taxon branch outside of crown (stem groups), there are much less taxonomic estimations. It is hard to guess, for example, how to care for Ar-chaeopteryx “dinosaur bird” because such organisms are not exist now and haveno living similarities.
Phenetics
The other way of making classification is even more mathematical. This is phe-netics based on multivariate methods of data analysis. One of its methods is cluster analysis which is described below.
1. Contrary to cladistics, phenetics considers characters as all equal and does not employ any evolutionary assumptions.
2. We need to decide which taxa we will need, assess their descriptions, ex-tract characters—all these is similar to cladistics (see above).
3. Character polarization is not needed, character codes may be specified more or less arbitrarily, and there is no need for outgroup.
4. Character table could be the same as in previous example (again, see above).
5. Then, we will need to create the square matrix (or table) of similarity:
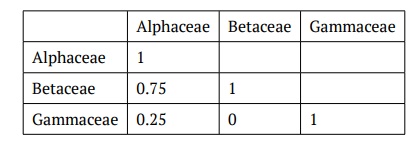
Every cell of this matrix contains a value of similarity K:
K =number of matching characters/number of all characters
Please note that there are many more relevant coefficients of similarity but they are out of our scope.
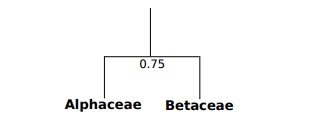
6. Then we need to make the dendrogram which is a tree-like structure. Tra-ditionally, dendrogram is built from bottom to top, from more similar to less similar groups. For example, we may start from connecting the closest taxa, Alphaceae and Betaceae:
7. Then we need to attach other taxa which are closest to previous group:
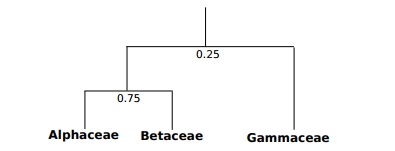
Sometimes, when we have multiple taxa, we end up with several indepen-dent groups (clusters). In that case, different clusters could be connected on the base of average similarity.
8. Betaceae and Alphaceae are closer, so we can unite them in one order:
Order Alphales
1. Family Alphaceae
2. Family Betaceae
Order Gammales
1. Family Gammaceae
Dichotomous keys
Diagnostics is a practical science which helps to determine living organisms.One of the best way of determining was invented in the end of 18 century by famous French naturalist, Jean-Baptiste Lamarck. He created the dichotomouskey (sometimes called descriptive key, or descriptive table).The legend says that when Lamarck demonstrated this key for the first time, he gave it to the random stranger (who had no idea about plants and their names), and plant were determined without problems! How to make such a key? The example is below:
1. We need to start with “players”. In this example, it will be same three plant families:
Alphaceae
Betaceae
Gammaceae
2. Assess descriptions of these three groups (we copy this from the above):
Alphaceae: Flowers red, petioles short, leaves whole, spines absent
Betaceae: Flowers red, petioles long, leaves whole, spines absent
Gammaceae: Flowers green, petioles short, leaves dissected, spines present
3. Start with a character which let to split the list into two nearly equal groups. Then add other character(s). It is always good to use more characters!
1. Petioles long . . . . . . . . . . . . . . . . . . . . . . . . . . . . . . . . . . . . . . . . Betaceae.
– Petioles short . . . . . . . . . . . . . . . . . . . . . . . . . . . . . . . . . . . . . . . . . . . . . 2.
2. Flowers red, leaves whole, spines absent . . . . . . . . . . . . . . Alphaceae.
– Flowers green, leaves dissected, spines present . . . . . . Gammaceae.
As you see here, key consists of steps. Every step has a number and typically two choices. Number is attached to the first choice whereas the second choice is marked with minus “–”. The choice will lead either to the name, or to another step. The choice sentence might contain several phrases, the first is the most important and the last is the least important.
Related Topics