Chapter: High Voltage Engineering : High Voltage Testing of Electrical Power Apparatus
Insulation Coordination
1. Insulation Coordination
Insulation Coordination is defined by the values of test voltages which the insulation of equipment under test must be able to withstand. In the earlier days of electric power, insulation levels commonly used were established on the basis of experience gained by utilities. As laboratory techniques improved, so that different laboratories were in closer agreement on test results, an international joint committee, the Nema-Nela Committee on Insulation Coordination, was formed and was charged with the task of establishing insulation strength of all classes of equipment and to establish levels for various voltage classification. In 1941 a detailed document18 was published giving basic insulation levels for all equipment in operation at that time. The presented tests included standard impulse voltages and one-minute power frequency tests.
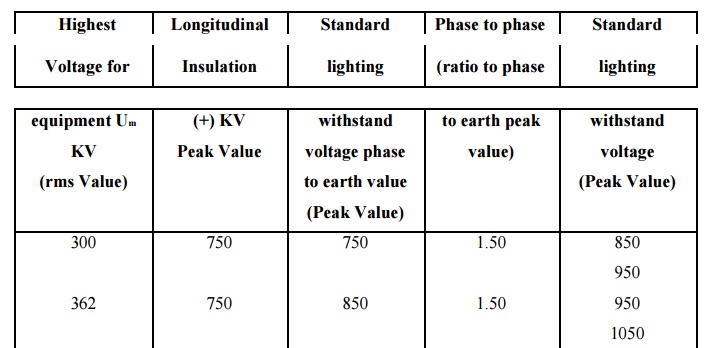
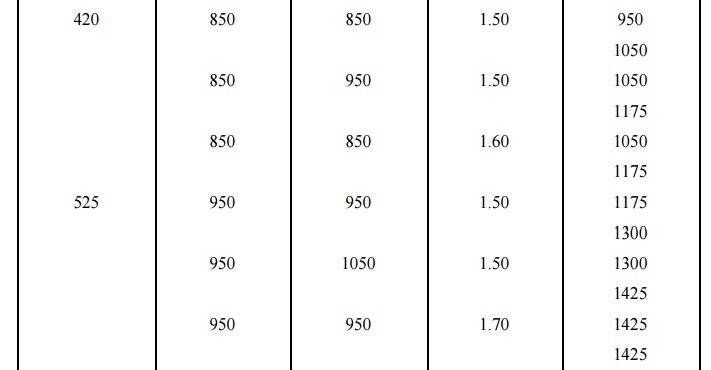
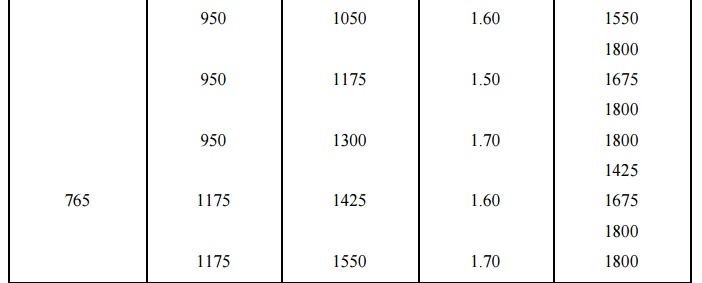
In today‘s systems for voltages up to 245 kV the tests are still limited to lightning impulses and one-minute power frequency tests, see section 5.3.Above 300 kV, in addition to lightning impulse and the one-minute power frequency tests, tests include the use of switching impulse voltages. Tables 5.2and 5.3 list the standardized test voltages for 245 kV and above ½300 kV respectively, suggested by IEC for testing equipment. These tables are based on a 1992 draft of the IEC document on insulation coordination.
Table 5.7 Standard insulation levels for Range II (Um > 245 kV) (From IEC document 28
CO 58, 1992, Insulation coordination Part 1: definitions, principles and rules)

2. Statistical approach to insulation coordination
In the early days insulation levels for lightning surges were determined by evaluating the 50 per cent flashover values (BIL) for all insulations and providing a sufficiently high withstand level that all insulations would withstand. For those values a volt–time characteristic was constructed. Similarly the protection levels provided by protective devices were determined. The upper curve represents the common BIL for all insulations present, while the lower represents the protective voltage level provided by the protective devices. The difference between the two curves provides the safety margin for the insulation system. Thus the Protection ratio=Max. Voltage it permits/Max.
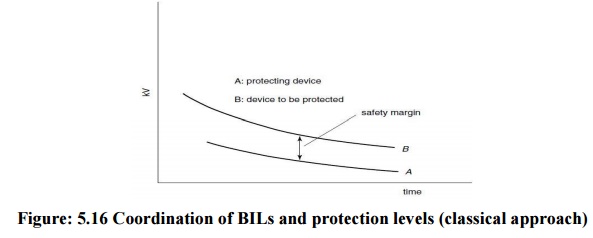
Figure: 5.16 Coordination of BILs and protection levels (classical approach)
This approach is difficult to apply at e.h.v. and u.h.v. levels, particularly for external insulations. Present-day practices of insulation coordination rely on a statistical approach which relates directly the electrical stress and the electrical strength. This approach requires knowledge of the distribution of both the anticipated stresses and the electrical strengths. The statistical nature of over voltages, in particular switching over voltages, makes it necessary to compute a large number of over voltages in order to determine with some degree of confidence the statistical over voltages on a system. The e.h.v. and u.h.v. systems employ a number of non-linear elements, but with today‘s availability of digital computers the distribution of over voltages can be calculated. A more practical approach to determine the required probability distributions of a system‘s over voltages employs a comprehensive systems simulator, the older types using analogue units, while the newer.
Employ real time digital simulators (RTDS).For the purpose of coordinating the electrical stresses with electrical strengths it is convenient to represent the overvoltage distribution in the form of probability density function (Gaussian distribution curve as shown in Figure) and the insulation breakdown probability by the cumulative distribution function. The knowledge of these distributions enables us to determine the ‗risk of failure‘. If Va is the average value of overvoltage, Vk is the kth value of over voltage, the probability of occurrence of overvoltage is p0Vk du, where as the probability of breakdown is PbVkor the probability that the gap willbreak down at an overvoltage Vk is PbVkp0Vk du. For the total voltage range we obtain for the total probability of failure or 'risk of failure‘.
1. over voltage distribution–Gaussian function.
2. Insulation breakdown probability–cumulative distribution)

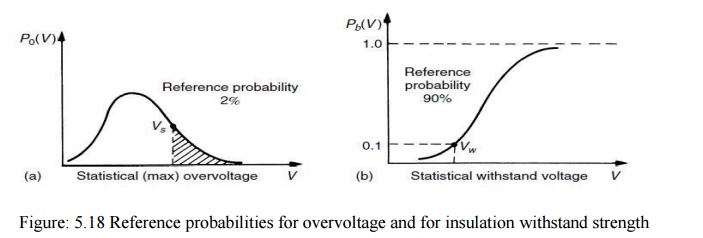
The risk of failure will thus be given by the shaded area under the curve R. In engineering practice it would become uneconomical to use the complete distribution functions for the occurrence of overvoltage and for the withstand of insulation and a compromise solution is accepted as shown in Figs 5.18 (a) and (b) for guidance. Curve (a) represents probability of occurrence of over voltages of such amplitude Vs that only 2 per cent (shaded area) has a chance to cause breakdown. VS are known as the ‗statistical overvoltage‘. In Fig. 5.18(b) the voltage Vw is so low that in 90 per cent of applied impulses, breakdown does not occur and such voltage is known as the ‗statistical withstand voltage‘ Vw.
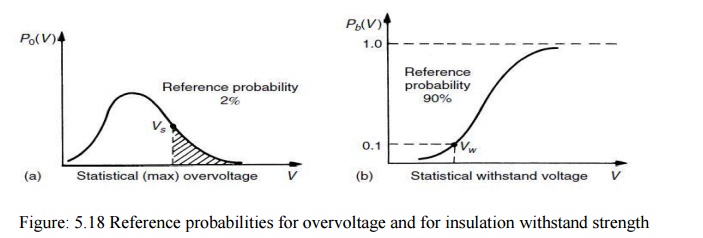
Figure: 5.18 Reference probabilities for overvoltage and for insulation withstand strength
In addition to the parameters statistical overvoltage ‗VS‘ and the statistical withstand voltage ‘VW‘ we may introduce the concept of statistical safety factor 4. This parameter becomes readily understood by inspecting Figs 5.19(a) to (c) in which the functions Pb V and p0Vk are plotted for three different cases of insulation strength but keeping the distribution of overvoltage occurrence the same. The density function p0Vkis the same in (a) to (c) and the cumulative function giving the yet undetermined withstand voltage is gradually shifted along the V-axis towards high values of V.
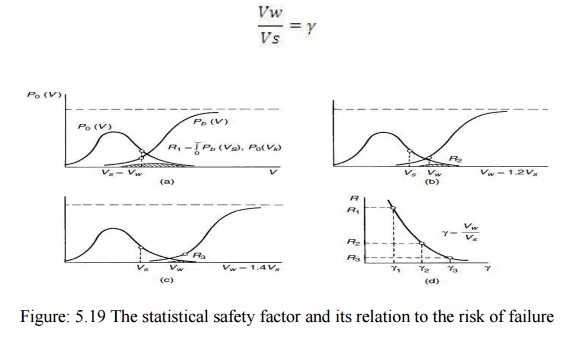
This corresponds to increasing the insulation strength by either using thicker insulation or material of higher insulation strength. As a result of the relative shift of the two curves [PbV and p0Vk] the ratio of the values Vw/Vs will vary. This ratio is known as the statistical safety factor.
3. Correlation between Insulation and Protection Levels
The ‗protection level‘ provided by (say) arresters is established in a similar manner to the insulation level‘; the basic difference is that the insulation of protective devices (arresters) must not withstand the applied voltage. The concept of correlation between insulation and protection levels can be readily understood by considering a simple example of an insulator string being protected by a spark gap, the spark gap (of lower breakdown strength)protecting the insulator string. Let us assume that both gaps are subjected to the same overvoltage represented by the probability density function p0V,Fig. 5.20. The statistical electrical withstand strength of the insulator string is given by a curve identical to Fig. 5.19 The probability of breakdown of this insulation remains in the area R which gives ‗risk of failure‘. Since the string is protected by a spark gap of withstand probability.
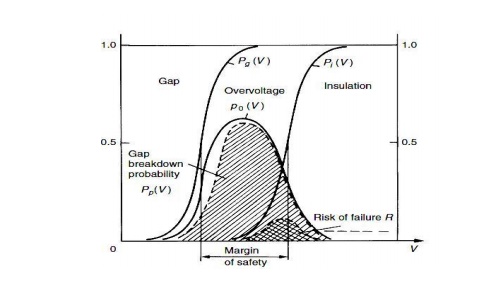
Figure: 5.20 Distribution functions of breakdown voltages for protective gap and protected insulation both subjected to an overvoltage p0 V
PgV, the probability that the gap will operate (its risk of failure) is obtained from integrating the productPgVp0VdV. In Fig.5.11 this probability is denoted (qualitatively) by PPV. As is seen the probability is much higher than the probability of insulation damage or failure R. In the same figure is shown the traditional margin of safety corresponding to the voltage.
Related Topics