Strengths and Weakness of Indian Economy, Demographic trends in India - Features of Indian Economy | 11th Economics : Chapter 7 : Indian Economy
Chapter: 11th Economics : Chapter 7 : Indian Economy
Features of Indian Economy
Features
of Indian Economy
1. Strengths of Indian Economy
1. India has a mixed economy
Indian
economy is a typical example of mixed economy. This means both private and
public sectors co-exist and function smoothly. On one side, some of the
fundamental and heavy industrial units are being operated under the public
sector,while, due to the liberalization of the economy, the private sector has
gained importance. This makes it a perfect model for public – private
partnership.
2. Agriculture plays the key role
Agriculture
being the maximum pursued occupation in India, it plays an important role in
its economy as well. Around 60% of the people in India depend upon agriculture
for their livelihood. In fact, about 17% of our GDP today is contributed by the
agricultural sector. Green revolution, ever green revolution and inventions in
bio technology have made agriculture self sufficient and also surplus
production. The export of agricultural products such as fruits, vegetables,
spices, vegetable oils, tobacco, animal skin, etc. also add to forex earining
through international trading.
3. An emerging market
India has
emerged as vibrant economy sustaining stable GDP growth rate even in the midst
of global downtrend. This has attracted significant foreign capital through FDI
and FII.India has a high potential for prospective growth. This also makes it
an emerging market for the world.
4. Emerging Economy
Emerging
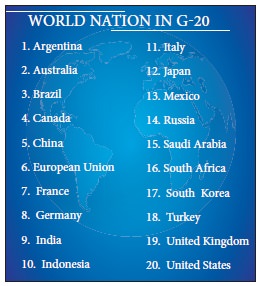
as a top economic giant among the world economy, India bags the seventh
position in terms of nominal Gross
Domestic Product (GDP) and third in terms of Purchasing Power Parity (PPP). As a
result of rapid economic growth Indian economy
has a place among the G20 countries.
5. Fast Growing Economy
India’s
economy is well known for high and sustained growth. It has emerged as the
world’s fastest growing economy in the year 2016 -17 with the growth rate of
7.1% in GDP next to People’s Republic of China.
6. Fast growing Service Sector
The
service sector, contributes a lion’s share of the GDP in India. There has been
a high rise growth in the technical sectors like Information Technology, BPO
etc. These sectors have contributed to the growth of the economy. These
emerging service sectors have helped the country go global and helped in
spreading its branches around the world.
7. Large Domestic consumption
With the
faster growth rate in the economy the standard of living has improved a lot.
This in
turn has resulted in rapid increase in domestic consumption in the country. The
standard of living has considerably improved and life style has changed.
8. Rapid growth of Urban areas
Urbanization
is a key ingredient of the growth of any economy. There has been a rapid growth
of urban areas in India after independence. Improved connectivity in transport
and communication, education and health have speeded up the pace of
urbanization.
9. Stable macro economy
The
Indian economy has been projected and considered as one of the most stable
economies of the world. The current year’s Economic survey represents the
Indian economy to be a “heaven of macroeconomic stability,
resilience and optimism. According to the Economic Survey for the year
2014-15, 8%-plus GDP growth rate has been predicted, with actual growth turning
out to be a little less (7.6%). This is a clear indication of a stable
macroeconomic growth.
10. Demographic dividend
The human
capital of India is young. This means that India is a pride owner of the
maximum percentage of youth. The young population is not only motivated but
skilled and trained enough to maximize the growth. Thus human capital plays a
key role in maximizing the growth prospects in the country. Also, this has
invited foreign investments to the country and outsourcing opportunities too.

2. Weakness of Indian Economy
1. Large Population
India
stands secondin terms of size of population next to China and our country is
likely to overtake china in near future. Population growth rate of India is
very high and this is always a hurdle to growth rate. The population growth
rate in India is as high as 1.7 per 1000.The annual addition of population
equals the total population of Australia.
2. Inequality and poverty
There
exists a huge economic disparity in the Indian economy. The proportion of
income and assets owned by top 10% of Indians goes on increasing. This has led
to an increase in the poverty level in the society and still a higher
percentage of individuals are living Below Poverty Line (BPL). As a result of
unequal distribution of the rich becomes richer and poor becomes poorer.
3. Increasing Prices of Essential Goods
Even
though there has been a constant growth in the GDP and growth opportunities in
the Indian economy, there have been steady increase in the prices of essential
goods. The continuous rise in prices erodes the purchasing power and adversely
affects the poor people, whose income is not protected.
4. Weak Infrastructure
Even
though there has been a gradual improvement in the infrastructural development
in the past few decades, there is still a scarcity of the basic infrastructure
like power, transport, storage etc.
5. Inadequate Employment generation
With
growing youth population, there is a huge need of the employment opportunities.
The growth in production is not accompanied by creation of job. The Indian
economy is characterized by ‘jobless growth’.
6. Outdated technology
The level
of technology in agriculture and small scale industries is still outdated and
obsolete.
3. Demographic trends in India
Scientific
study of the characteristics of population is known as Demography. The various
aspects of demographic trends in India
are:
·
Size of population
·
Rate of growth
·
Birth and death rates
·
Density of population
·
Sex-ratio
·
Life-expectancy at birth
·
Literacy ratio
a. Size of Population
Over a
period of 100 years, India has quadrupled its population size. In terms of,
size of population, India ranks 2nd in the world after China. India has only
about 2.4% of the world’s geographical area and contributes less than 1.2% of
the world’s income, but accommodates about 17.5% of the world’s population. In
other words, every 6th person in the world is an Indian. Infact, the combined
population of just two states namely, Uttar Pradesh and Maharashtra is more
than the population of United States of America, the third most populous
country of the world. Some of the states in India have larger population than
many countries in the world.
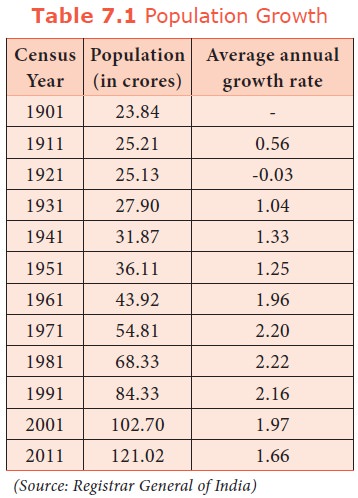
The
negative growth during 1911-21 was due to rapid and frequent occurrence of
epidemics like cholera, plague and influenza and also famines. The year 1921 is
known as the ‘Year of Great Divide’ for India’s population
as population starts increasing.
During
1951, population growth rate has come down from 1.33% to 1.25%. Hence it is
known as ‘Year of Small divide’.
In 1961,
population of India started increasing at the rate of 1.96% i.e, 2%. Hence 1961
is known as ‘Year of Population Explosion’. In the year
2001, the Population of India crossed one billion (100 crore) mark.
The 2011
census reveals growth of youth population which is described as ‘demographic
transition’.
b. Birth rate and death rate
Crude Birth rate: It refers
to the number of births per thousand of population.
Crude Death rate: It refers
to the number of deaths per thousand of population
Crude birth and death rates of
India during various years
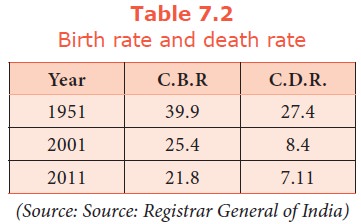
Birth
rate was 39.9 in 1951; it fell to 21.8 in 2011. Although the birth rate has
declined, the decline is not so remarkable. The death rate has declined from
27.4 in 1951 to 7.1 in 2011. However, from the data it is clear that the fall
in birth rates is less than that of death rates.
Kerala
has the lowest birth rate (14.7) and Uttar Pradesh has the highest birth rate
(29. 5). West Bengal has the lowest death rate (6.3) and Orissa (9.2) has the
highest. Among States Bihar has the highest decadal (2001- 11) growth rate of
population, while Kerala has the lowest growth rate. The four states Bihar,
Madhya Pradesh, Rajasthan and Uttar Pradesh called BIMARU states have very
high population.
c. Density of population
It refers
to the average number of persons residing per square kilometre. It represents
the man - land ratio. As the total land area remains the same, an increase in
population causes density of population to rise.
Density of population = Total population / Land
area of the region
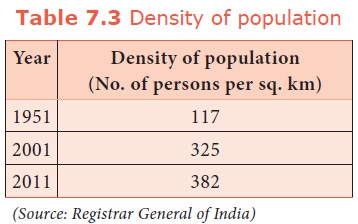
Just
before Independence, the density of population was less than 100. But after
independence, it has increased rapidly from 117 in 1951 to 325 in 2001.
According to 2011 census, the present Density of population is 382. Thus, the
pressure of population on land has been rising. Kerala, West Bengal, Bihar and
Uttar Pradesh have density higher than the India’s average density. Bihar is
the most densely populated state in the country with 1,102 persons living per
sq.km followed by West Bengal with 880. Arunachal Pradesh has low density of
population of only 17 persons.
d. Sex ratio
It refers
to the number of females per 1,000 males. It is an important indicator to
measure the extent of prevailing equity between males and females at a given
point of time.
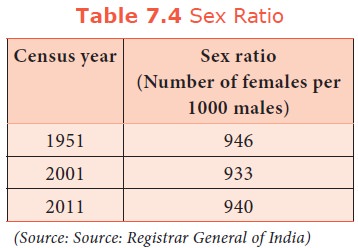
In India,
the sex ratio is more favourable to males than to females. In Kerala, the adult
sex ratio is 1084 as in 2011. The recent census (2011) shows that there has
been a marginal increase in sex ratio. Haryana has the lowest sex ratio of 877
(2011) among other states, while Kerala provides better status to women as
compared to other States with 1084 females per 1000 males
e. Life expectancy at birth
It refers
to the mean expectation of life at birth. Life expectancy has improved over the
years. Life expectancy is low when death rate is high and / or instances of
early death are high. On the other hand, life expectancy is high when death
rate is low and / or instances of early death are low.
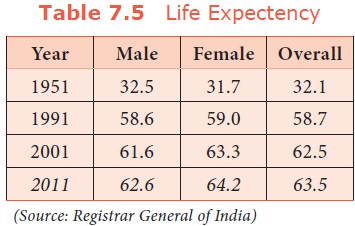
During 1901 – 11, life expectancy was just 23 years. It increased to 63.5 years in 2011. A considerable fall in death rate is responsible for improvement in the life expectancy at birth. However the life expectancy in India is very low compared to that of developed countries.
f. Literacy ratio
It refers
to the number of literates as a percentage of the total population. In 1951,
only one-fourth of the males and one-twelfth of the females were literates.
Thus, on an average, only one-sixth of the people of the country were
literates. In 2011, 82% of males and 65.5% of females were literates giving an
overall literacy rate of 74.04% (2011). When compared to other developed
countries and even Sri Lanka this rate is very low.
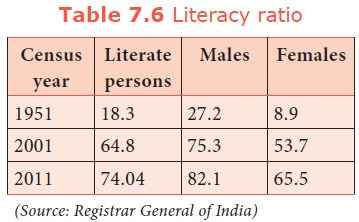
Kerala
has the highest literacy ratio (92%) followed by Goa (82%), Himachal Pradesh
(76%), Maharastra (75%) and Tamil Nadu (74%) . Bihar has the lowest literacy
ratio (53%) in 2011.
Related Topics