Chapter: 11th Economics : Chapter 7 : Indian Economy
Demographic trends in India
Demographic
trends in India
Scientific
study of the characteristics of population is known as Demography. The various
aspects of demographic trends in India
are:
·
Size of population
·
Rate of growth
·
Birth and death rates
·
Density of population
·
Sex-ratio
·
Life-expectancy at birth
·
Literacy ratio
a. Size of Population
Over a
period of 100 years, India has quadrupled its population size. In terms of,
size of population, India ranks 2nd in the world after China. India has only
about 2.4% of the world’s geographical area and contributes less than 1.2% of
the world’s income, but accommodates about 17.5% of the world’s population. In
other words, every 6th person in the world is an Indian. Infact, the combined
population of just two states namely, Uttar Pradesh and Maharashtra is more
than the population of United States of America, the third most populous
country of the world. Some of the states in India have larger population than
many countries in the world.
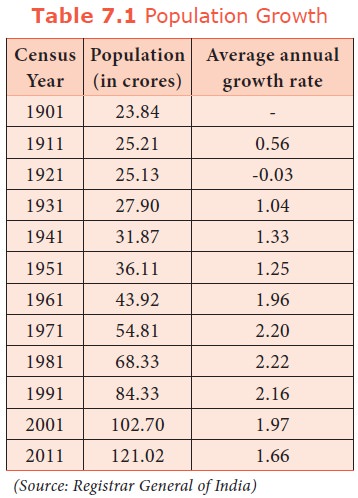
The
negative growth during 1911-21 was due to rapid and frequent occurrence of
epidemics like cholera, plague and influenza and also famines. The year 1921 is
known as the ‘Year of Great Divide’ for India’s population
as population starts increasing.
During
1951, population growth rate has come down from 1.33% to 1.25%. Hence it is
known as ‘Year of Small divide’.
In 1961,
population of India started increasing at the rate of 1.96% i.e, 2%. Hence 1961
is known as ‘Year of Population Explosion’. In the year
2001, the Population of India crossed one billion (100 crore) mark.
The 2011
census reveals growth of youth population which is described as ‘demographic
transition’.
b. Birth rate and death rate
Crude Birth rate: It refers
to the number of births per thousand of population.
Crude Death rate: It refers
to the number of deaths per thousand of population
Crude birth and death rates of
India during various years
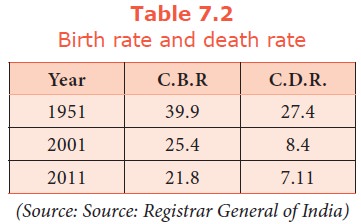
Birth
rate was 39.9 in 1951; it fell to 21.8 in 2011. Although the birth rate has
declined, the decline is not so remarkable. The death rate has declined from
27.4 in 1951 to 7.1 in 2011. However, from the data it is clear that the fall
in birth rates is less than that of death rates.
Kerala
has the lowest birth rate (14.7) and Uttar Pradesh has the highest birth rate
(29. 5). West Bengal has the lowest death rate (6.3) and Orissa (9.2) has the
highest. Among States Bihar has the highest decadal (2001- 11) growth rate of
population, while Kerala has the lowest growth rate. The four states Bihar,
Madhya Pradesh, Rajasthan and Uttar Pradesh called BIMARU states have very
high population.
c. Density of population
It refers
to the average number of persons residing per square kilometre. It represents
the man - land ratio. As the total land area remains the same, an increase in
population causes density of population to rise.
Density of population = Total population / Land
area of the region
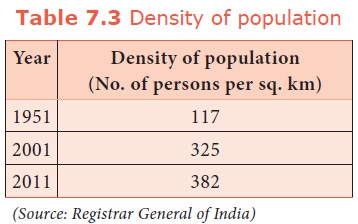
Just
before Independence, the density of population was less than 100. But after
independence, it has increased rapidly from 117 in 1951 to 325 in 2001.
According to 2011 census, the present Density of population is 382. Thus, the
pressure of population on land has been rising. Kerala, West Bengal, Bihar and
Uttar Pradesh have density higher than the India’s average density. Bihar is
the most densely populated state in the country with 1,102 persons living per
sq.km followed by West Bengal with 880. Arunachal Pradesh has low density of
population of only 17 persons.
d. Sex ratio
It refers
to the number of females per 1,000 males. It is an important indicator to
measure the extent of prevailing equity between males and females at a given
point of time.
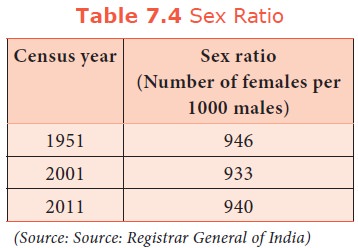
In India,
the sex ratio is more favourable to males than to females. In Kerala, the adult
sex ratio is 1084 as in 2011. The recent census (2011) shows that there has
been a marginal increase in sex ratio. Haryana has the lowest sex ratio of 877
(2011) among other states, while Kerala provides better status to women as
compared to other States with 1084 females per 1000 males
e. Life expectancy at birth
It refers
to the mean expectation of life at birth. Life expectancy has improved over the
years. Life expectancy is low when death rate is high and / or instances of
early death are high. On the other hand, life expectancy is high when death
rate is low and / or instances of early death are low.

During
1901 – 11, life expectancy was just 23 years. It increased to 63.5 years in
2011. A considerable fall in death rate is responsible for improvement in the
life
expectancy
at birth. However the life expectancy in India is very low compared to that of
developed countries.
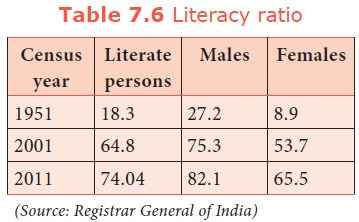
f. Literacy ratio
It refers
to the number of literates as a percentage of the total population. In 1951,
only one-fourth of the males and one-twelfth of the females were literates.
Thus, on an average, only one-sixth of the people of the country were
literates. In 2011, 82% of males and 65.5% of females were literates giving an
overall literacy rate of 74.04% (2011). When compared to other developed
countries and even Sri Lanka this rate is very low.
Kerala
has the highest literacy ratio (92%) followed by Goa (82%), Himachal Pradesh
(76%), Maharastra (75%) and Tamil Nadu (74%) . Bihar has the lowest literacy
ratio (53%) in 2011.
Related Topics