Chapter: Modern Analytical Chemistry: Kinetic Methods of Analysis
Evaluation of Chemical Kinetic Methods
Evaluation of Chemical Kinetic Methods
Scale of Operation
The detection limit for chemical kinetic methods ranges
from minor components to ultratrace components and is principally determined by two factors:
the rate of the reaction
and the instrumental method used for monitoring the rate. Because
the signal is directly proportional to the reaction rate,
faster reactions generally result in lower
detection limits. All
other considerations being equal,
the detection limit
is smaller for
catalytic reactions than for noncatalytic reactions. Not surprisingly, chemical
kinetic methods based
on catalysis were among the earliest techniques for trace-level analysis. Ultratrace
analysis is also possible when using catalytic reactions. For example,
ultratrace levels of Cu (<1 ppb)
can be determined by measuring its
catalytic effect on the redox
re- action between hydroquinone and H2O2. Without
a catalyst, most chemical kinetic methods for organic compounds
involve reactions with relatively slow rates, limit- ing the method to minor and
higher concentration trace
analytes. Noncatalytic chemical kinetic methods for inorganic compounds involving
metal–ligand com- plexation may be fast or slow, with detection limits ranging from trace to minor lev- els of analyte.
The second factor
influencing detection limits
is the instru- mental method used to monitor the
reaction’s progress. Most reactions
are monitored spectrophotometrically or electro- chemically.
Accuracy
As noted earlier, chemical kinetic methods
are po- tentially subject
to larger errors
than equilibrium methods
due to the effect of uncontrolled or poorly controlled
variables, such as temperature and solution
pH. Although the direct-
computation chemical kinetic methods described can
yield results with
moderate accuracy (1–5%),
re- action systems
are encountered in which accuracy is quite
poor. An improvement in accuracy may be realized
by using curve-fitting methods. In one
study, for
example, accuracy was improved by two orders
of magnitude (500–5%) by replacing a direct-computation analysis with a curve-fitting analysis.
Although not discussed in this, data analy- sis
methods that include
the ability to compensate for
experi- mental error can lead to a significant improvement in accuracy.
Precision
The precision of a chemical
kinetic method is lim-
ited by the signal-to-noise ratio of the instrumental method used to monitor the reaction’s progress.
With integral methods, precisions of 1–2% are routinely possible. The precision for dif-
ferential methods may be somewhat
poorer, particularly for noisy signals,
due to the difficulty in measuring the slope of a
noisy rate curve.19 It may
be possible to improve the
precision in this case by using a combination of signal averaging
and smoothing of the data before its analysis.
Sensitivity
The sensitivity for a one-point fixed-time integral method of
analysis is improved by making measurements under conditions in which the concentration of the
monitored species is larger rather
than smaller. When the analyte’s concentra- tion, or the concentration of any other reactant, is
monitored, measurements are best made early
in the reaction before its concentration has substantially decreased. On the other hand, when a product is used to monitor the reaction, measurements are more appropriately made
at longer times.
For a two-point fixed-time integral method, sensitivity is improved by increasing the
difference between times
t1 and t2. As discussed earlier, the
sensitivity of a rate method
improves when using
the initial rate.
Selectivity
The analysis
of closely related
compounds, as we have seen in earlier, is often complicated by their tendency
to interfere with one an- other. To overcome this problem, the analyte and interferent must first be sepa-
rated. An advantage of chemical kinetic methods is that conditions can often be adjusted so that the analyte and interferent have different reaction
rates. If the difference in rates is large enough,
one species may react completely before the other
species has a chance to react. For
example, many enzymes
selectively cat- alyze a single substrate, allowing the quantitative analysis of that substrate in the presence of similar substrates.
The conditions necessary to ensure that
a faster-reacting species
can be kineti- cally separated from a more slowly
reacting species can be determined from the ap- propriate integrated rate laws.
As an example, let’s consider
a system consisting of an analyte, A, and an interferent, B, both of which show
first-order kinetics with
a common reagent. To avoid an interference, the
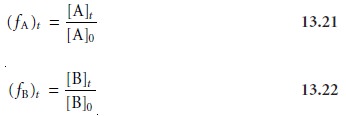
relative magnitudes of their rate constants must be sufficiently different. The fractions, f, of A and B remaining at any point in time, t, are
given as

For a first-order reaction we can write, from equations 13.2,
13.21, and 13.22
ln(fA)t =
–kAt
ln(fB)t = –kBt
Taking the ratio of these two equations gives

then the rate constant for A must be 458 times larger
than that for B. Under
these conditions the analyte’s concentration can be determined before
the interferent be- gins
to react. If the analyte
has the slower reaction, then it can be determined after the interferent’s reaction
is complete.
The method described
here is impractical when the simultaneous analysis of both A and B is desired. The difficulty
in this case is that conditions favoring
the analysis of A generally
do not favor the
analysis of B. For
example, if condi- tions are adjusted
such that 99% of A reacts in 5 s, then B must reach 99% com- pletion
in either 0.01 s if it has the faster kinetics or 2300 s if it has the slower
kinetics.
Several additional approaches for analyzing mixtures have been developed that do not require
such a large
difference in rate
constants.3,4 Because both A and
B react at the
same time, the
integrated form of the first-order rate law becomes
Ct = [A]t + [B]t = [A]0e–kAt +
[B]0e–kBt ………………….13.23
where Ct is the total
concentration of A and B. If Ct is measured at times t1 and t2, the resulting pair of simultaneous equations can be solved to give [A]0 and [B]0.
The rate constants kA and kB must be determined in separate experiments using standard solutions of A and B. Alternatively, if A and B react
to form a common
product, P, equation 13.23 can be written
as
Pt = [A]0(1 – e–kAt) + [B]0(1 – e–kBt)
Again, a pair of simultaneous equations at times t1 and t2 can be solved
for [A]0 and [B]0.

Equation 13.23 can
also be used
as the basis
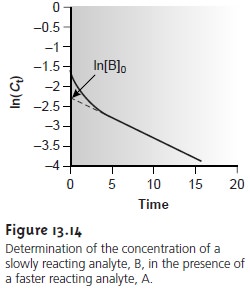
for a curve-fitting method. As shown in Figure 13.14,
a plot of ln(Ct) as a function of time consists of two regions. At short times the plot is curved since
A and B are reacting
simultaneously. At later times, however, the concentration of the faster-reacting component, A, decreases to 0, and equation
13.23 simplifies to

Under these conditions a plot of ln(Ct) versus time is linear. Extrapolating the linear portion to time 0 gives [B]0, and [A]0 is determined by difference.
Time, Cost, and Equipment
Automated chemical kinetic methods of analysis provide a rapid means for analyzing samples,
with throughputs ranging
from several hundred to
several thousand determinations per hour. The initial start-up costs, however, may be fairly
high because an automated analysis
requires a dedicated in- strument designed to meet the specific needs of the analysis. When handled manu- ally, chemical kinetic methods
can be accomplished using equipment and instru-
mentation routinely available in most laboratories. Sample throughput, however,
is much lower than with automated methods.
Related Topics