Chapter: Pharmaceutical Drug Analysis: Emission Spectroscopy
Emission Spectroscopy: Theory
THEORY
The theoretical aspects of emission spectroscopy may be
categorized into the following four
heads, namely :
(a) Spectra :
A beam of light on being
passed either through a Nicol’s prism or a grating, is split-up right into its
constituent array of colours frequently termed as spectrum. However, the complete spectrum has a wide range that may
be further divided into various regions based on their respective wavelengths
(0 to 35,000° A) :
(i) Ultraviolet Region : It embraces
radiations of wavelengths between 0 to 4000° A,
(ii) Visible Region : It includes radiations
of wavelengths between 4000 to 7300° A, and
(iii) Infrared Region : It has radiations of
wavelengths between 7300 and 35,000° A.
(b) Classes of Spectra :
There exist, in
fact, two major types of spectra commonly termed as emission spectra and the absorption spectra which shall be
discussed briefly as follows below :
(i) Emission Spectra : An element on being
heated to a very high temperature either by electri-cal method or a thermal
method-usually emits light. This particular light after passing through either
a prism or a grating when studied directly with the help of a spectroscope,
gives rise to a spectrum, that is termed as emission spectrum.
(ii) Absorption Spectra : A source of light
emits a continuous spectrum when first made to pass through an absorbing
substance and subsequently through a spectroscope. It has been noticed that a
few lines are missing in the observed spectrum thereby leaving either dark
bands or lines at their respective places. Because the light of wavelength
exactly corresponding to these dark bands (or lines) is found to be absorbed by
the substance through which light is passed, the resulting spectrum is called
as an absorption spectrum.
(c) Classification of Emission Spectra :
The emission spectra may be classified into the following three types, namely :
(i) Band Spectra (or Molecular Spectrum) :
Each molecule upon excitation gives out a band spectrum (or bands) that are
characteristics of the molecule. In fact, a band spectrum com-prises of groups
of lines so near to one another that under normal circumstances they more or
less seem to appear as continuous bands.
However, in emission spectroscopy the band spectra
provided by molecules may be elimi-nated completely by giving energy to the
corresponding molecules so that they may be split-up into separate atoms.
(ii) Continuous Spectra : A continuous
emission spectrum is obtained when solids are heated to incandescence. The
thermal radiation of this nature is termed as black-body radiation, which has
the following three characteristic
features, namely :
(a) Dependent
more on the temperature of the emitting surface than the material of which the
surface is made of,
(b) Caused by
the innumerable atomic and molecular oscillations excited in the condensed
solid by the thermal energy, and
(c) Independent
of the chemical composition of the substance.
Example : Incandescent solids, e.g.,
carbon and iron give rise to continuous emission spectra when they are heated until they glow.
Hence, it is pertinent to mention here that the
continuous spectrum cannot be employed effectively for spectrochemical analysis
and these spectra may be eliminated completely by volatalizing the material
(sam-ple) before excitation.
(iii) Line Spectra : Line spectra are usually
encountered when the light emitting substance i.e., the radiating species are separate atomic entities
(particles) which are distinctly separated from one another, as in gas.
Therefore, it is invariably known as ‘atomic spectrum’. As the line spectrum
depends solely upon the type of an atom, hence it enjoys the status of a
predominant type of emission spectroscopy.
Bohr’s theory rightly explains the
fundamental origin of ‘line spectrum’ according
to which :
·
An atom in the ground state has its electrons present in
the lowest permitted energy-levels,
·
An excited atom (by thermal or electrical means) has its
electrons migrate from inner orbitals (specifically valence electrons) to outer
orbitals,
·
The excited electrons quickly give a photon of energy of
immediately take the position in an orbital having the lowest energy (or ground
state), and
·
The emission of radiation from the excited atoms give
rise to distinct spectral lines thereby form-ing the basis of emission
spectroscopy.
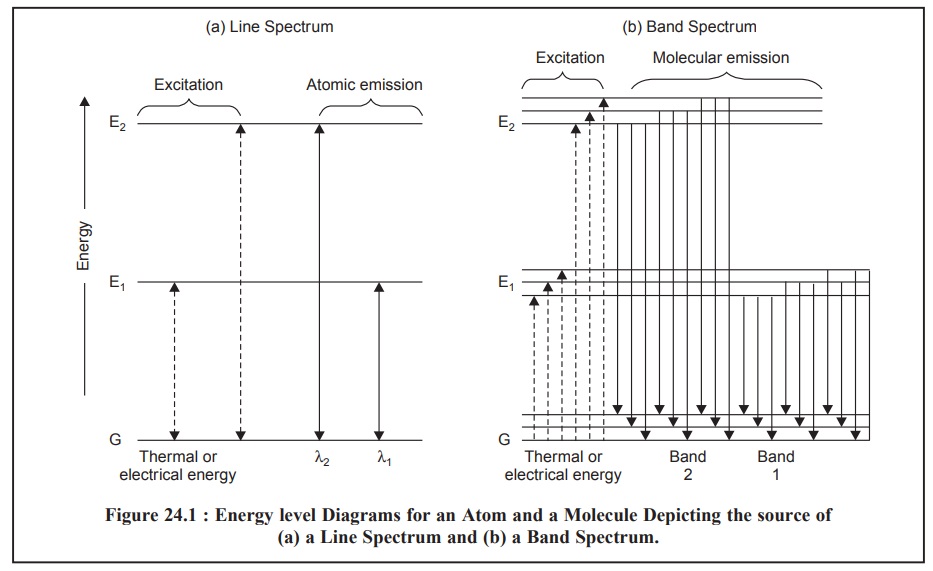
Figure 24.1, depicts the energy-level diagrams both for
an atom and a simple molecule illustrating the source of a line-spectrum and a
band-spectrum as discussed above in (iii)
and (i).
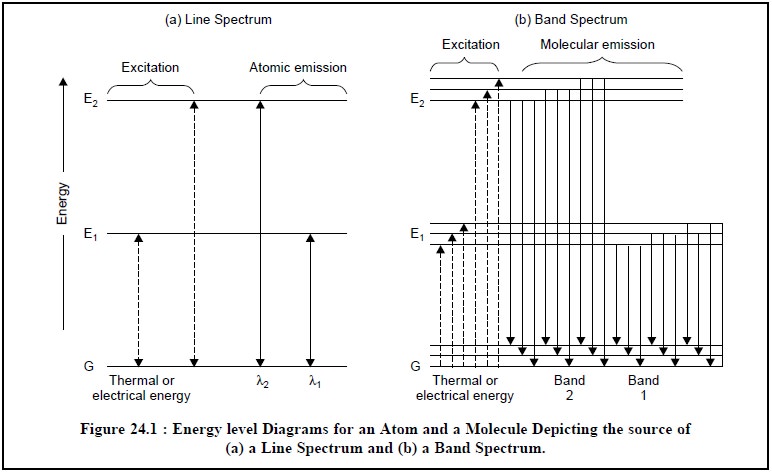
Figure 24.1 (a),
designates the energy level diagram displaying the source of the lines in a
typical spectrum of an element, where :
G = The horizontal line represents the ground state
energy or the lowest energy of an atom (say Na atom), and
E1 and E2 = Represent the two
higher energy electronic levels of the atom (say Na atom).
For a Na atom the single-outer-electron in the lowest
ground state G is situated in the 3s
orbital. Consequently, the energy level E1 might designate the
energy of the atom when this ‘single electron’ has been duly raised to the 3p state by virtue of its absorption of
thermal, electrical or radiant energy. This phenomenon has been clearly shown
with the help of the dotted-line in Figure : 24.1 (a). However, the atom ultimately gets back to its ground state, may
be after 10–8 s, thereby emitting radiation whose frequency is given
by the following expression :
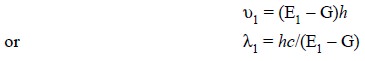
This particular phenomenon is depicted by the solid-line
in Figure 24.1 (a). In the case of Na
atom E2 designates the highly energetic 4p state and the radiation λ2 obtained therefrom will
appear at a relatively shorter wavelength.
Figure 24.1 (b),
represents the energy level diagram of a molecule where the energy differences
among the various quantized vibrational and rotational states are comparatively
much smaller as compared to the electronic states. The horizontal lines are due
to the many excited vibrational states whereas the energy differences due to
rotational states have not been shown in the said Figure. Thus, the multitude
of various energy states is clearly shown by the solid lines in Figure 24.1 (b), whereby two distinct bands of
radiation are obtained, each of which consists of a huge number of closely
spaced lines.
(d) Effect of Concentration on Line and Band Spectra :
The radiant power by virtue of the radiant energy, of a line or
band exclusively depends directly on the total number of excited atoms or
molecules present, which is subsequently proportional to the total
concentration of the species present in the source. Therefore, we may have the following
expression :
P = kC
where,
P = Radiant power,
C = Total concentration of the species, and
k = Constant of proportionality
The aforesaid relationship forms the basis of
quantitative emission spectroscopy.
(e) Excitation-Energy Requirements :
A
single spectral-line is emitted from an element only when the energy equivalent
to the excitation potential of the element is usually absorbed. This particular
requirement is very critical and important. Exactly in a similar manner, the
full-fledged complete spectrum is obtained possibly only when the energy
equivalent to the ionization potential is ab-sorbed by a molecule.
(f) Limitations of Emission Spectroscopy :
The emission spectroscopy has a number of limitations that are enumerated below
briefly :
Perhaps all the elements
present in the periodic table might be excited to yield respective emission
spectra by employing a huge energetic source. However, it has a serious
drawback because most of the spectral lines invariably fall within the
vacuum-ultraviolet region thereby rendering their critical studies rather
difficult. Hence, the emission spectroscopy is exclusively limited to metals
and metalloids. The non-metals, for instance : Phosphorus, Sulphur, Carbon etc.
are not limited to these studies.
Emission spectroscopy of
sodium vis-a-vis uranium : Emission spectroscopy is
mainly based on sensitivity which is
inversely proportional to the complexity of the atomic spectra. In ac-tual
practice, it has been observed that the spectra of alkali-metals, like : K, Na,
Li, Rb appear to be very simple and hence they may be studied conveniently
without any difficulty. It is also pertinent to mention here that these spectra
usually comprise of 13 to 14 adequately spaced lines having reasonably good
sensitivity and possessing wavelengths.
In the specific case of sodium the resulting emission
spectrum shall exhibit characteristic yellow lines. The spectrum is so highly
sensitive that even the traces of Na show yellow lines distinctly.
In the case of other elements, for instance : Uranium,
the emission spectrum normally displays thousands of narrowly spaced lines.
However, the emission source possesses a fixed amount of energy which shall be
spread up eventually amongst the thousands of lines thereby mini-mizing the
sensitivity of each line. Hence, it is rather difficult to examine the less
sensitive complex spectra of elements such as uranium.
Related Topics