Chapter: Pharmaceutical Drug Analysis: Emission Spectroscopy
Emission Spectroscopy: Instrumentation
INSTRUMENTATION
The various essential components of a reasonably good
emission spectrograph are as follows, namely :
(i) Excitation
sources,
(ii)
Electrodes,
(iii) Sample
Handling,
(iv)
Monochromators,
(v) Detectors,
and
(vi)
Spectrographs.
1. EXCITATION SOURCES
The excitation sources may be sub divided into the
following two heads, namely :
(a) Salient Features of Excitation Sources :
These should fulfil the following procedural require-ments :
·
Sample should be changed into its vaporised form,
·
Vaporised form of sample must be dissociated into atoms,
·
Electrons present in the atoms should be excited from the
ground state to higher-energy-levels,
·
Capable of exciting atoms of most of the elements of
interest (in the Periodic Table),
·
To produce sufficient line-intensity in order to detect
these lines within the scope of the ‘de-tection
limit’, and
·
Must essentially achieve reproducible excitation
conditions of various samples.
(b) Types of Excitation Sources : The
various types of excitation sources are as follows :
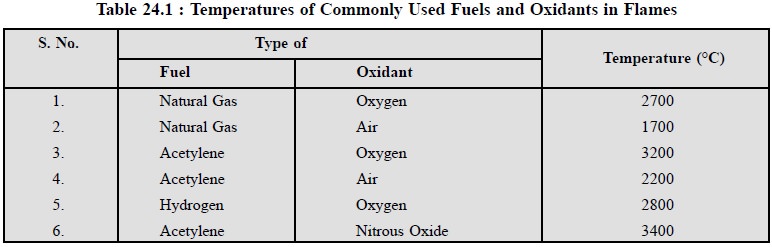
(i) Flames : A flame is generally employed
for such molecules that do not need either very high temperatures for
excitation or dissociation into atoms. Flames are comparatively inexpensive and
cater for both stable and reproducible sources of excitation that can
effectively handle a wide-range of typical analytical problems. However, the
temperature of the flame is guided by a number of vital factors, such as :
·
Types of Fuel and Oxidant,
·
Fuel to Oxidant Ratio,
·
Type of Burner Employed, and
·
Zone (or region) in flame which is focussed into the
entrance-slit of spectral-isolation-unit.
Table 24.1, records the temperatures of commonly used
fuels and oxidants in flames in emission spectroscopy.
Note : (1) The temperature of
the flame and the composition of the flame afford a direct influence on
interferences which may give rise to erroneous results,
(2) The dissociation of
molecules and excitation of atoms usually occur at a specific temperature.
(ii) Direct Current Arc : It is considered
to be one of the most versatile excitation modes used extensively for
quantitative spectrochemical emission analysis. Figure 24.2 represents the
differ-ent essential components of the circuit for a direct current are
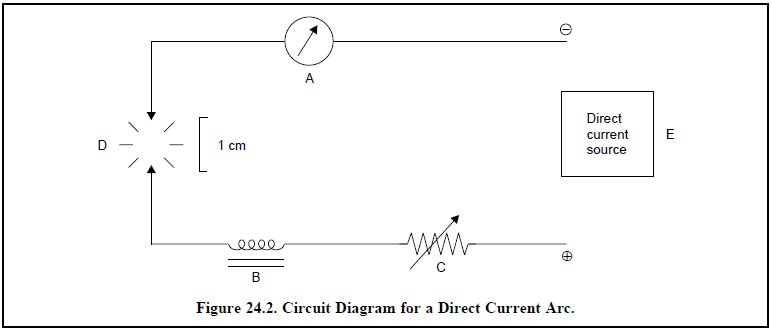
A = An Ammeter (Range 3 to 30 A),
B = Inductance Coil,
C = Variable Resistance (Range 10 to 40 Ω)
D = Arc Gap (Range from 20 mm to 1 cm), and
E = Direct Current Source (Range 110 to 220 V at 3 to 30
A).
Procedure : The various procedural steps
are as follows :
·
Current is passed across the arc-gap in series with the
help of a variable resistor C (10 – 40 Ω)
and an inductance coil B.
·
Initial resistance caused due to air-gap is very high to
allow conduction of current. Hence, the arc is first initiated by narrowing its
gap momentarily while 110-220 V DC is applied. Once the current picks up flow,
the temperature across the arc-gap shoots up promptly. The electrodes are
pulled apart leaving a gap of 20 mm to 1 cm, thereby establishing the electric
arc whose tempera-ture varies from 4000 to 8000° K.
·
Sample (solid or liquid) is usually introduced upon the
lower electrode between the arc-gap, and
·
Variable resistance (C) adjusts the intensity of current,
whereas inductance coil (B) stabilizes its flow.
Merits of Direct-Current-Arc :
They
are as follows :
·
Provides a very sensitive excitation source :
·
Excitation energy is solely thermal and not electrical
which is more than enough for exciting all the metal elements, and
·
DC-arc gives rise to emission species that are
exclusively neutral atoms rather than ions.
(i)
Alternating Current Arc : Figure 24.3 depicts the
various essential components of the circuit diagram for an alternating current
arc :
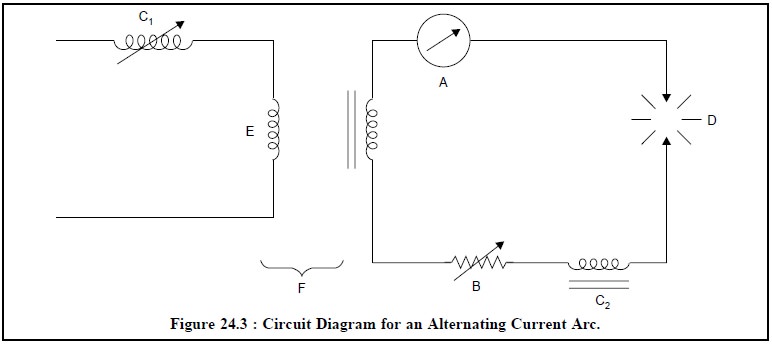
Where,
A = Ammeter (Range 3 to 30 A)
B = Variable Resistance,
C1 = Variable Inductance in the Primary
Circuit,
C2 = Inductance Coil in the Main Circuit,
D = Arc Gap (Range from 20 mm to 1 cm),
E = Primary Circuit, and
F = Step-up Transformer (Range 2000 to 5000 V).
Procedure : The procedural details are
stated below :
·
Step-up transformer (F) maintains a high voltage of 2000
to 5000 V, which helps the arc to jump the gap,
·
Variable inductance (C1) is adjusted duly to
maintain a current of 1 to 5 A in the primary circuit,
·
Current in the main circuit is alternating at a frequency
of 60 Hz thereby extinguishing the arc 120 times in one second, and
·
After each cycle the arc picks out a new surface area
whereby the entire surface of the sample under examination, is exhaustively
arced and subsequently excited.
It is worthwhile noting that the arc-gap temperature in
this case is considerably lower than the direct-current arc, due to the
stop-and start nature of the source, which ultimately offers a much lower
sensitivity.
2. ELECTRODES
The electrodes normally employed in emission spectroscopy
are of two types, namely :
(a) Self Electrodes : If the material
(sample) under probe is itself not only a good conductor but also can tolerate
very high temperatures (in the arc-gap),
the material may be used as the electrode ; and such electrodes are termed as self-electrodes.
Examples : Pure metal powders may be
compressed into solid discs or cylinders which can be used as electrodes. Likewise, the analyzing alloys can also be
used.
(b) Graphite Electrodes : If the material
(sample) under study is neither a good conductor nor can afford to tolerate
high temperatures, it is usually kept in a small cavity of the lower graphite
electrode whereas the upper electrode (graphite) is given a pointed
sharp-shape. These electrodes have centre posts which minimises wandering-of-the-arc source thereby
improving the reproducibility ; and their narrow neck improves the sensitivity
appreciably.
3. SAMPLE HANDLING
Two types of samples are usually examined by emission
spectroscopy, namely :
(a) Solids : Solid samples can also be
sub-divided into two categories, such as : (i)
Those possessing good conductance characteristics and can withstand high
temperatures : it can be achieved by making electrodes with the material
directly to be used for the electrical discharge ; (ii) Those having poor conductance and cannot withstand high
temperatures : it can be powdered mixed with the powdered graphite (known as
buffer) and placed in the depression of the lower graphite elec-trode. On
passing the electrical discharge the material (sample) is first vaporised into
the body of the discharge and subsequently the spectrographic emission occurs.
(b) Liquids : Liquid samples may be
dispensed conveniently with the aid of two types of small-holders, namely : firstly, wherein the porous base of the
cup gradually releases the sample into the discharge from the top ; and secondly, wherein the rotating-disc
carriers take up the sample into the discharge from the bottom steadily.
Note : (1) Both types are found to be suitable for
either aqueous or non-aqueous solvents, and
(2) Samples dissolved in
organic solvents usually ignite in the discharge which may produce erratic
emission. It is more prominent in the rotating-disc type sample carriers.
4. MONOCHROMATORS
Monochromators help to isolate and separate the various
lines of the sample’s emission spectrum.
Two types are generally used in the emission
spectroscopy, namely :
(a) Prism Monochromators : In usual
practice, the materials of construction of prisms are either quartz or silica
(fused) because of their absolute transparency to UV-radiation. Prism
monochromators normally bring forth two
serious shortcomings which are discussed briefly here, namely :
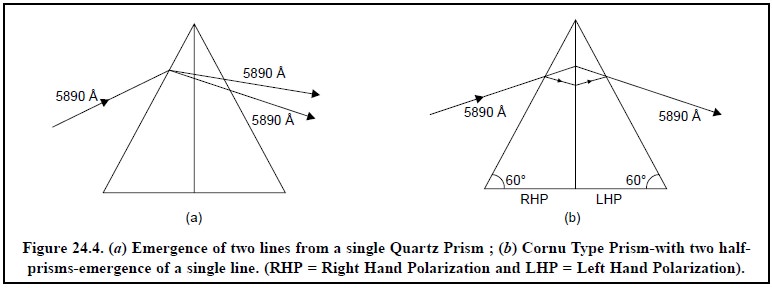
First, when light from a single
emission-line (of one particular wavelength) is made to pass through a quartz (or glass) prism, it emerges
from the other side of the prism as two different lines as shown in Figure 24.4
(a). This splitting-up of one line
into two separate lines affords not only the loss of the emerged light’s
intensity but also complicates the interpretation of the spectrum ; thereby
rendering its use both in qualitative and quantitative analysis rather
difficult. Cornu Type Prisms eliminate this lacuna completely. In this case,
two-half prisms are joined together : the first half-prism splits the incident
emission line into two separate beams, whereas the second-half prism recombines
them into a single emergent beam as shown in Figure 24.4 (b).
Secondly, the dispersion of a prism is
never constant over a wide range of wavelength, whereby the identification of either the emission lines or the unknown
wavelengths is rather difficult on the basis of simply measuring their
dispersions.
(b) Grating Monochromators : The various
advantages of grating monochromators are as follows :
·
Much better resolution
achieved : thereby
resulting in the development of many sophisticated equipments,
·
Offers absolute linear
dispersion : thereby
replacing prisms completely as the dispersing ele-ment inspite of its
high-cost, and
·
Resolution is constant and
independent of wavelength : thereby the identification of the wave-length of emission
lines on a photographic plate is simplified i.e.,
once a known reference line is identified, other lines may be known very
conveniently.
Disadvantage : The major disadvantage of
grating monochromators is that its higher-order-wave-lengths overlap which may
be eliminated completely either by using filters or by employing detectors that
are not sensitive to the higher-orders.
5. DETECTORS
There are two
types of detectors that are used most frequently in emission spectroscopy,
namely :
(a) Photographic Detectors-used for
qualitative analysis, and
(b) Photomultiplier Detectors-used for
quantitative analysis.
The two
detectors shall be discussed here briefly.
5.1. Photographic Detectors
Many spectrographs record the intensity of spectral lines
on a photographic emulsion directly, which is subsequently developed by an
appropriate ‘developer’ in the
prescribed duration at a specific recom-mended temperature.
Procedure : The various steps involved are
as follows :
(i)
A beam of light is passed through a clear zone of the
film and subsequently the intensity of the transmitted beam is measured by
means of a phototube fitted in the densitometer,
(ii)
A beam of light is then passed through the darkened zone
of the film and the intensity is measured as stated above,
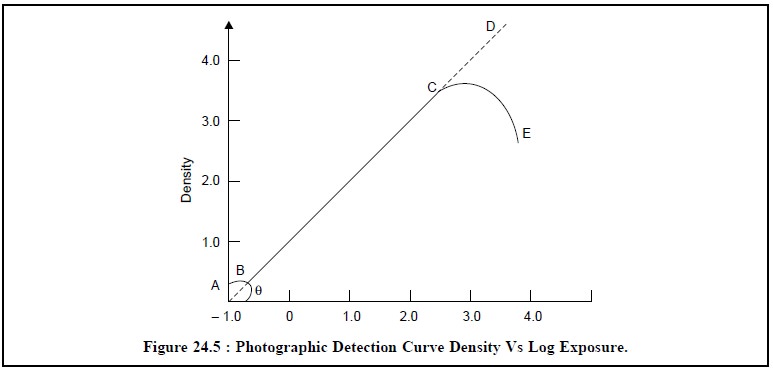
(iii)
The logarithm of the ratio of the intensity of the light
transmitted through the clear zone and the darkened zone is computed ; and is
plotted against the logarithm of the exposure as shown in Figure 24.5.
(iv)
The region BC in Figure 24.5 clearly shows that the
density is directly proportional to the loga-rithm of the intensity of the
curve and represents the most useful zone of the curve, and
(v)
The slope of region BC is usually called as the ‘gamma’ (γ)
of the emulsion of photographic plate and is expressed as :
γ= tan θ
Consequently, it may be inferred that when the value of γ is
high, it is indicative of the fact that high-degree of contrast is expected ;
and if γ has a low value, naturally low-degree of contrast is
deemed for.
(b) Photomultiplier Detectors :
Spectrographs that record the direct-reading emissions exclusively essentially
make use of photomultiplier detectors instead of a photographic plate. It
requires a large number of photomultiplier tubes for carrying out the detection
of different emission lines simultaneously and that is way the direct-reading
devices are relatively much costlier. By virtue of its convenience, fast and
more accurate and precise results, this type of detectors is always preferred.
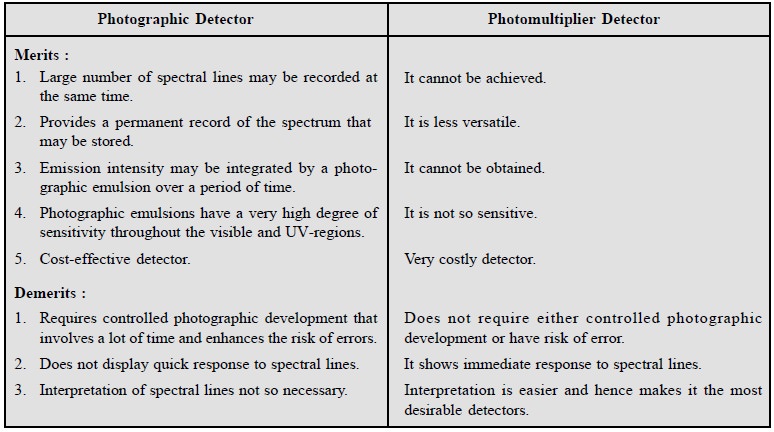
However, it is worthwhile to have a comparison of the
merits and demerits of photographic and photomultiplier detectors side-by-side
as follows :
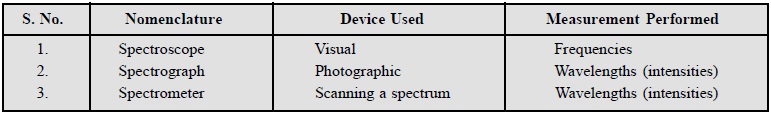
6. SPECTROGRAPHS
The resulting ‘emission
spectra’ from the detector may be thoroughly studied with the aid of an
effective optical arrangement which will critically identify the frequencies
and their respective intensities. The optical arrangement varies from one
instrument to another based on the device used, and hence the nomenclature also
varies, namely :
However, the various commercially available spectrographs
may be differentiated solely by the fact whether they make use of either a ‘prism’ or a ‘grating’ as the vital dispensing medium. A good ‘spectrograph’
using either a prism or a grating shall be discussed briefly here.
(a) Littrow Type Spectrograph (i.e., a Prism Instrument)
Figure 24.6, shows the schematic diagram of a Littrow Type spectrograph which
essentially has the following components, namely :
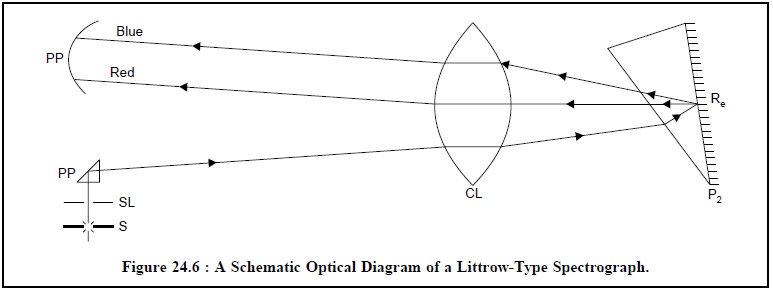
S = Excitation source,
SL = Slit,
P1 = A reflecting prism,
CL = A collimating lens,
P2 = Littrow prism,
RC = Reflective coating (mirrored surface), and
PP = Photographic plate.
A Littrow type
spectrograph makes use of a Littrow-type prism exclusively which is made
from a single piece of Quartz with its rear-surface mirrored or metallized
(with Silver). This sort of prism com-pletely eliminates the polarization
effects as the beam of light moves back and forth through the body of the same
prism. Thus, a beam of light from the source of light (S) passes through the
slit (SL), gets reflected through the reflecting prism (P1),
penetrates through the collimating lens (CL), enters the Littrow prism (P2),
again gets reflected by its reflective coating (RC), enters the collimating
lens (CL) and finally comes out as a spectrum that is recorded on the
photographic plate (PP).
It is interesting to observe that a typical large Littrow
Spectrograph having a single Quartz prism covers a wavelength range from 2000
to 80000 Å.
(b) Ebert-Mounting Spectrograph (i.e., a Grating Instrument)
An Ebert-mounting
spectrograph exclusively makes use of a plane-grating rather than a
concave-grating as employed either in Rowland
mounting or in Eagle arrangement.
It enormously helps as the ruling of the grating is a lot easier and less
complicated. In this particular optical device a concave mirror (CM) is used to
render the radiation striking the grating (G) parallel and also to focus the
dispersed (-o-o-o-) radiation on the photographic plate of the camera.
Figure 24.7, depicts the schematic diagram of a Ebert-Mounting Spectrograph with the
following vital components.
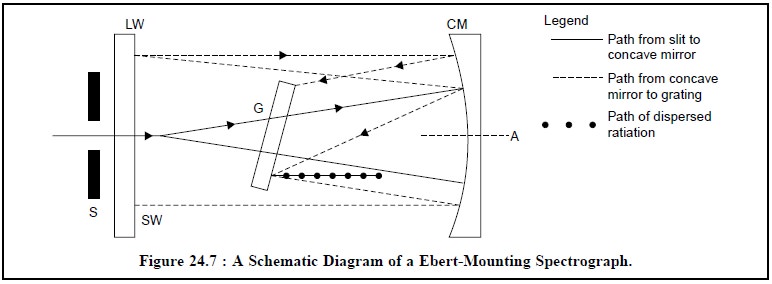
S = Slit,
G = Grating,
CM = Concave Mirror,
LW = Longer wavelength,
SW = Shorter wavelength, and
A = Axis.
Salient Features of
Ebert-Mounting Spectrographs : The various salient features are, namely :
·
Gratings normally have 600 to 120 lines per mm,
·
Covers a wavelength range from 1800-30,000 Å,
·
Possess the highest wavelength range, and
·
Possible to observe high-order visible and UV-spectra.
Related Topics