Thematic Map - Dot Method | 12th Geography : Chapter 11 : Thematic Mapping
Chapter: 12th Geography : Chapter 11 : Thematic Mapping
Dot Method
Dot Method
The dot method is a convenient method
of representing absolute numbers on maps. Each dot is assigned with a value and
the number of dots, can be placed within an area as per their distribution pattern.
This method is useful not only to provide a good visual impression and a realistic
distribution pattern but also it helps in understanding correlations.
Uses of dot Method
They are drawn to show the distribution
of population, cattle, area under crops, output of commodities, etc., when data
is given in absolute figures administrative unit-wise.
Size of dots
Dots should be round and of uniform size.
They should be of small size but as small as a fine point. Dots of about 1 to1.5
mm diameter may be drawn as they are quite effective. The value given to a dot should
be determined carefully and keeping in view the highest and the lowest values.
Placing of dot
The placing of dots should conform to
the geographic conditions of a particular area. The knowledge of the geographical
conditions of the area is necessary for placing the dots correctly. Sandy, stony
and forested areas are naturally unimportant for the production of agricultural
crops and human settlements. Marshy areas and areas occupied by lakes, river beds,
etc., being negative are left without dots. Unproductive lands are called negative
lands. It is better if negative areas are first identified and shaded lightly with
a lead pencil. Thus the placing of dots on negative areas can be easily avoided.
The areas shaded with pencil are erased with a rubber eraser after the dots have
been placed on the map.
Requirements for the preparation of a dot map
To prepare a dot map we need an outline
map of the area showing boundaries of the administrative divisions. For the sake
of the greater accuracy, it is advisable to have the administrative divisions as
small as possible. Topographical sheets, irrigation maps, relief maps, soil distribution
maps, rainfall distribution maps, etc., of the area are also useful for drawing
a dot map.
Steps to construct a dot map
* Obtain a base map of the area or administrative
regions you wish to show.
* Study the data to be mapped and decide
on a dot value (should be a rounded number).
* Determine on an appropriate dot shape
and size. As a general guide, dots that are too small to produce an overly sparse
dot pattern which is not very precise.
* Place the correct number of dots with
each administrative boundary as determined in step 2.
Example:
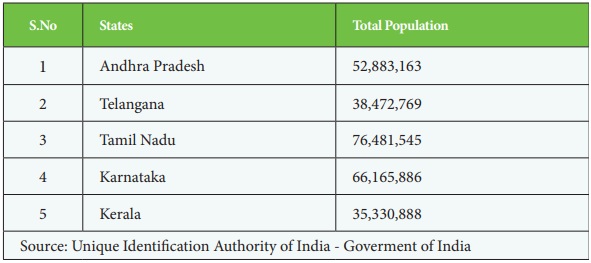
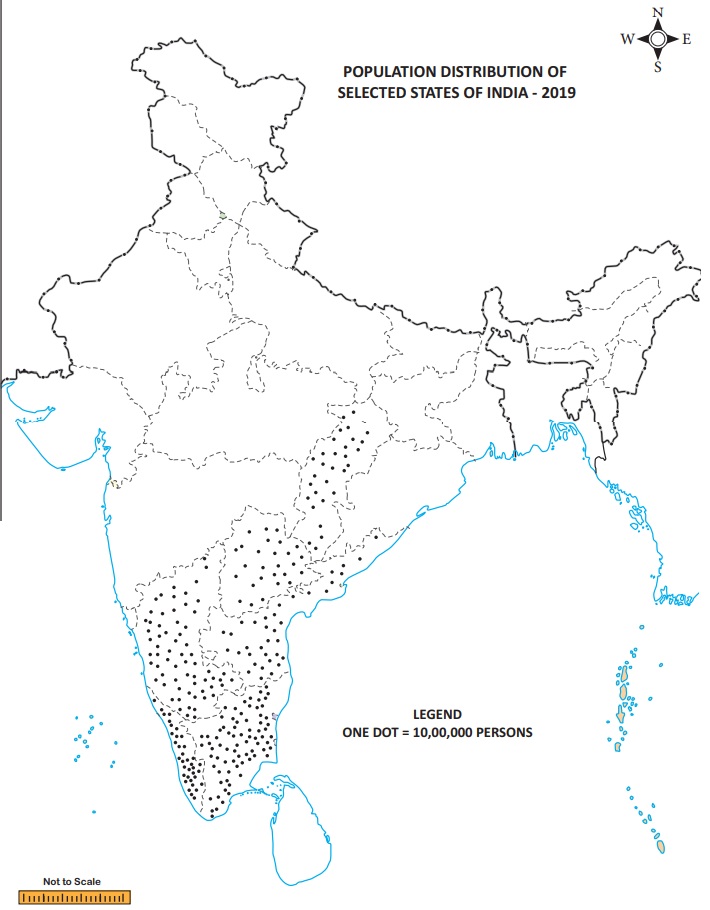
Construct a dot map to represent population data as given in Table 11.1.
Table 11.1 Population Distribution of selected states of India - 2019
Construction
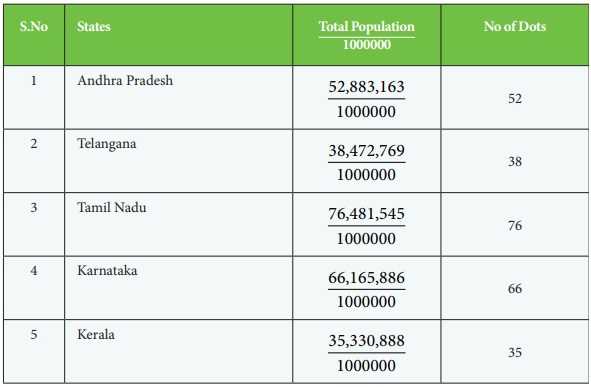
Step 1: One dot • = 1,000,000 Persons
Step 2: Calculation of dots
Related Topics