Chapter: 12th EM Geography : Chapter 1 : Population Geography
Composition of Population
Composition of
Population
Composition
of Population includes sex ratio, literacy rate, age pyramids etc.
Sex Ratio
The
sex ratio is the ratio of males to females in a population.
As
of 2014, the global sex ratio at birth is estimated at 107 boys to 100 girls
(1000 boys per 934 girls).
The sex ratio of India is 933
females for every 1000 males according to 2011.
Kerala
has the highest sex ratio in the country with 1084 females for 1000 males
followed by Puducherry with 1037 females for 1000 males and Tamil Nadu with 996 females for 1000 males.
Fact File
Qatar-315 Males per 100 females (2019)
With an astounding ratio of 315 males to a 100 females, Qatar holds the number one spot among countries with the highest male to female ratio in the world in 2018.
What Are Population Age Pyramids?
Population pyramids are
graphical representations of the age
and sex of a population. For this reason, population pyramids are also referred
to as age-sex pyramids. We refer to
these graphs as pyramids because they are usually shaped like triangles and
population pyramids also take other shapes. Population pyramids usually have
males on the left side and females on the right. There is also a vertical line
in the middle of the graph that separates the males from the females.
Fact File
Latvia, country with the highest sex ratio in
the world.
Latvia is a former Soviet Union
country and experienced a great decline in male population during World War
two. By 2015, there were 84.8 males for every 100 females. The proportion of
the female was 54.10% of the total population. Men in Latvia have a high
mortality rate due to issues such as alcoholism, smoking, and careless car driving.
Around 80% of suicides in Latvia are committed by men, often because of
unemployment and unrealized financial goals. Women enjoy a longer life
expectancy living 11 years more than men.
Literacy Rate
Total
number of literate persons in a given age group, expressed as a percentage of
the total population in that age group.
Literacy
rates continue to rise from one generation to the next. Yet according to new
data from the UNESCO Institute for Statistics, there are still 750 million
illiterate adults, two-thirds of whom are women. These numbers are a stark
reminder of the work ahead to meet Sustainable Development Goals (SDGs) 4 and 5
and the Education 2030 targets.
Literacy rate variations between states in India
India's
literacy rate is at 74.04%. Kerala
has achieved a literacy rate of 93.91%.
Bihar is the least literate
state in India, with a literacy of 63.82%.
Several other social indicators of the two states are correlated with these
rates, such as life expectancy at birth (71.61 for males and 75 for females in
Kerala, 65.66 for males and 64.79 for females in Bihar), infant mortality per
1,000 live births (10 in Kerala, 61 in Bihar), birth rate per 1,000 people
(16.9 in Kerala, 30.9 in Bihar) and death rate per 1,000 people (6.4 in Kerala,
7.9 in Bihar).
Six
Indian states account
for about 70% of all illiterates
in India: Uttar Pradesh, Bihar,
Madhya Pradesh, Rajasthan, Andhra Pradesh and West Bengal. Slightly less than
half of all Indian illiterates (48.12%) are in the six Hindi-speaking states of
Uttar Pradesh, Bihar, Rajasthan, Madhya Pradesh, Jharkhand and Chhattisgarh.
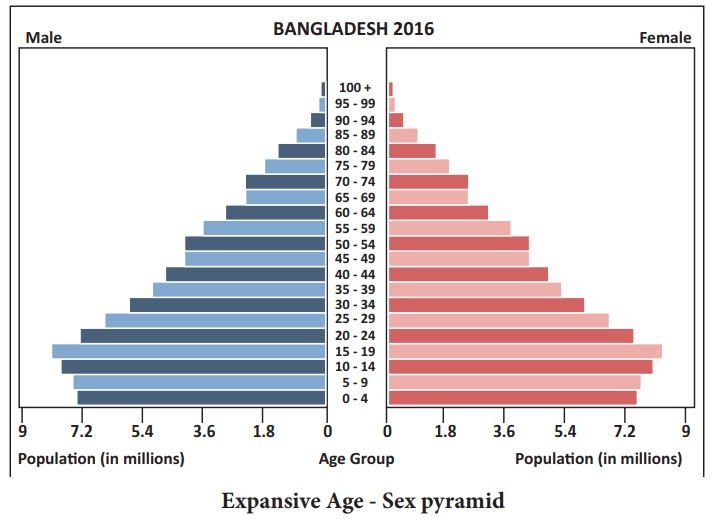
Age - Sex pyramids
There
are three types of Age - Sex pyramids: expansive, constrictive, and stationary.
Expansive Age - Sex pyramids depict populations that have a larger percentage
of people in younger age groups. Populations with this shape usually have high
fertility rates with lower life expectancies. Many third world countries have
expansive Age - Sex pyramids. Such a population pyramid is a characteristic of
newly developing countries such as Afghanistan, Bangladesh, Kenya, and some
countries of Latin America.
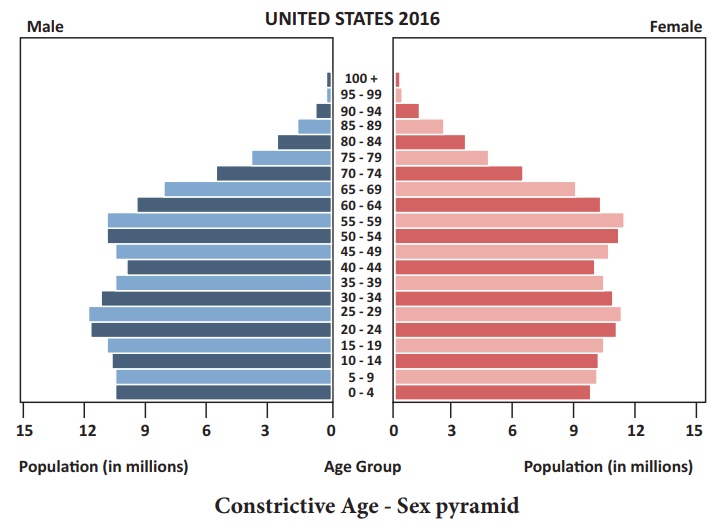
Constrictive Age - Sex pyramids are named so because they are constricted at the bottom. There is a lower percentage of younger people. Constrictive Age - Sex pyramids show declining birth rates, since each succeeding age group is getting smaller and smaller. The United States has a constrictive Age - Sex pyramid.
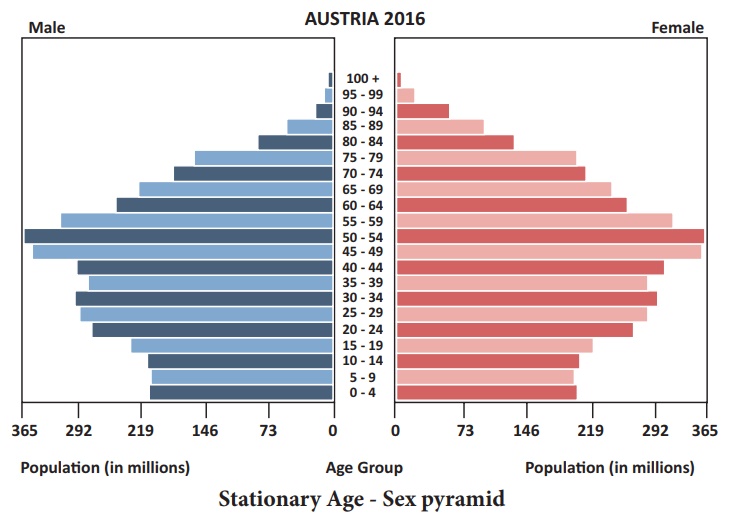
Stationary Age - Sex pyramids are
those that show a somewhat equal
proportion of the population in each age group. There is not a decrease or
increase in population; it is stable. Austria
has a stationary Age - Sex pyramid.
The Purpose of the Age - Sex Pyramid
The
purpose of making this Age - Sex pyramid is to find out the comparison between
the number of men and women, the number of workers, and the structure of the
population in a country quickly. In addition, the creation of the Age - Sex
Pyramid also has a purpose to assist the government in taking development
policies.
Related Topics