Chapter: Modern Analytical Chemistry: Calibrations, Standardizations, and Blank Corrections
Blank Corrections
Blank Corrections
In
discussing ways to standardize a method, we assumed that an appropriate
reagent blank had
been used to correct Smeas for signals originating from sources other than the analyte.
At that time we did not ask an important question—
“What constitutes an appropriate reagent blank?” Surprisingly, the
answer is not intuitively obvious.
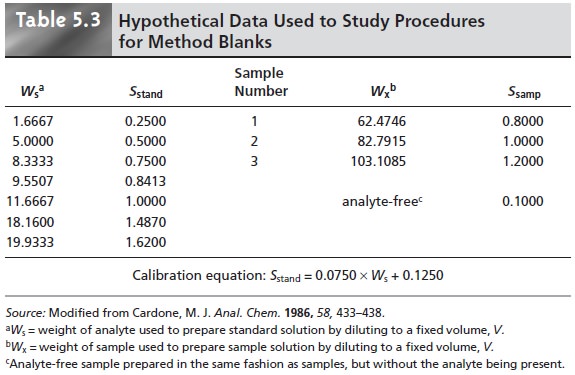
In one study, analytical chemists were asked to evaluate a data set
consist- ing of a normal calibration curve, three samples
of different size
but drawn from the same source, and an analyte-free sample (Table 5.3).
At least four different
approaches for correcting the signals were used by the participants: (1) ignore the
correction entirely, which
clearly is incorrect; (2) use the y-intercept of the calibration curve as a calibration blank,
CB; (3) use the analyte-free sample as a reagent blank, RB;
and (4) use both the calibration and
reagent blanks. Equa- tions for calculating the concentration of analyte using
each approach are shown
in Table 5.4, along with the resulting concentration for the analyte in each of the three
samples.
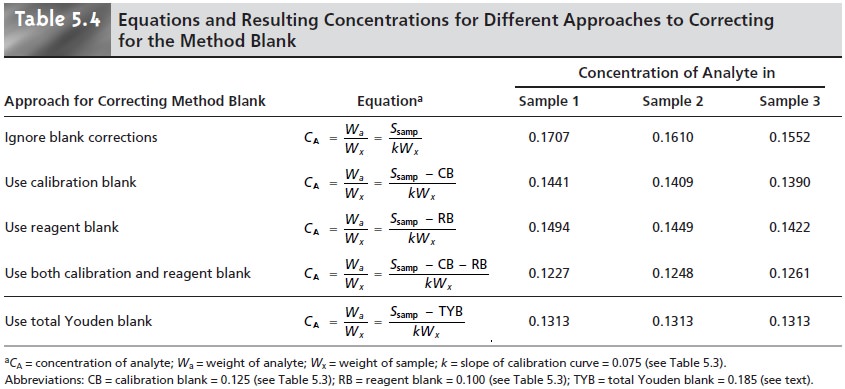
That all four
methods give a different result
for the concentration of analyte underscores the importance of choosing a proper blank but does not tell us which
of the methods is correct.
In fact, the variation within
each method for the reported concentration of analyte
indicates that none of these
four methods has adequately corrected for the blank.
Since the three
samples were drawn
from the same source,
they must have the
same true concentration of analyte.
Since all four methods
predict concentrations of analyte that
are dependent on the size
of the sample, we can conclude that none of these blank
corrections has accounted for an underlying constant
source of determinate error.
To correct for all constant method errors, a blank must account for signals due to the reagents and solvent used in the analysis and any bias due to interactions between the analyte and the sample matrix.
Both the calibration blank
and the reagent blank correct
for signals due
to the reagents and solvents. Any
differ- ence in their
values is due to the number and composition of samples contribut- ing to the determination of the blank.
Unfortunately, neither the calibration blank
nor the reagent
blank can cor- rect for bias due
to analyte–matrix interactions because the analyte
is missing in the
reagent blank, and
the sample’s matrix
is missing from
the calibration blank.
The true method
blank must include
both the matrix
and the analyte
and, conse- quently, can only be determined using the sample
itself. One approach
is to mea- sure the signal for samples of different
size and determine
the regression line from
a plot of signal versus
the amount of sample. The resulting y-intercept gives the signal for the condition of no sample and is known as the total Youden blank.13
This is the
true blank correction. The regression line
for the sample
data in Table 5.3 is
Ssamp = 0.009844 x Wx + 0.185
giving
a true blank correction
of 0.185. Using this value to correct the signals gives identical values for the concentration of analyte in all three
samples (see Table 5.4,
bottom row).
The total Youden blank is not encountered frequently in analytical work, because most chemists rely on a calibration blank when using calibration curves and rely on reagent blanks when using a single-point standardization. As long as any constant bias due to analyte–matrix interactions can be ignored, which is often the case, the accuracy of the method will not suffer. It is always a good idea, however, to check for constant sources of error, by analyzing samples of different sizes, before relying on either a calibration or reagent blank.
Related Topics