Chapter: The Diversity of Fishes: Biology, Evolution, and Ecology: Systematic procedures
Approaches to classification
Approaches to classification
Three general philosophies of classification have dominated scientific thought in the area of systematics: cladistics, phenetics, and evolutionary systematics.
A revolution in systematic methodology was begun by a German entomologist, Willi Hennig. He introduced what has become known as cladistics, or phylogenetic systematics, following publication of the 1966 English translation of an extensively revised version of his 1950 German monograph. His fundamental principle was to divide characters into two groups: apomorphies (more recently evolved, derived, or advanced characters) and plesiomorphies (more ancestral, primitive, or generalized characters). The goal isto find synapomorphies (shared derived characters) that diagnose monophyletic groups, or clades (groups containing an ancestor and all its descendant taxa). Symplesiomorphies(shared primitive characters) do not provide data useful for constructing phylogenetic classifications because primitive characters may be retained in a wide variety of distantly related taxa; advanced as well as primitive taxamay possess symplesiomorphies. Autapomorphies, specialized characters that are present in only a single taxon, are important in defining that taxon but are also not useful inconstructing a phylogenetic tree.
All three major systematic approaches produce some sort of graphic illustration that depicts the different taxa, arranged in a manner that reflects their hypothesized relationships. In cladistics, taxa are arranged on a branching diagram called a cladogram.
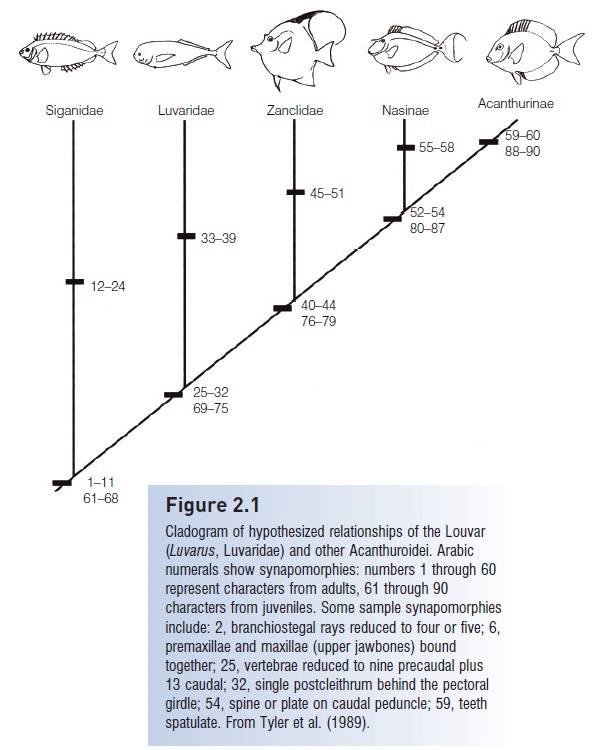
Figure 2.1
Cladogram of hypothesized relationships of the Louvar(Luvarus, Luvaridae) and other Acanthuroidei. Arabicnumerals show synapomorphies: numbers 1 through 60represent characters from adults, 61 through 90characters from juveniles. Some sample synapomorphiesinclude: 2, branchiostegal rays reduced to four or five; 6,premaxillae and maxillae (upper jawbones) bound
together; 25, vertebrae reduced to nine precaudal plus13 caudal; 32, single postcleithrum behind the pectoralgirdle; 54, spine or plate on caudal peduncle; 59, teethspatulate. From Tyler et al. (1989).
Monophyletic groups are defined by at least one synapomorphyat a node, or branching point, on the cladogram. Deciding whether a character is plesiomorphic or apomorphicis based largely on outgroup analysis, that is, finding out what characters are present inoutgroups, closely related groups outside the taxon under study, which is designated the ingroup. More than one outgroup should be used to protect against the problem of interpreting an apomorphyin an outgroup as a symplesiomorphy. The polarity of acharacter or the inferred direction of its evolution (e.g.,from soft-rayed to spiny-rayed fins) is determined usingoutgroup comparison or ontogeny.Sister groups are the most closely related clades in the nodes of a cladogram. Problems arise when there are homoplasies, which are shared, independently derived similarities such asparellelisms,convergences, or secondary losses. These do notreflect the evolutionary history of a taxon.
A primary goal of phylogenetic systematics is the definition of monophyletic groups. Current researchers agree on the necessity of avoiding polyphyletic groups – groups containing the descendants of different ancestors. Most researchers are equally adamant that monophyletic should be equal to holophyletic, groups containing all the descendants of a single ancestor, and avoiding paraphyletic groups, groups that do not contain all the descendants of a single ancestor. Grades are groups that are defined by their morphological or ecological distinctness and not necessarily bysynapomorphies.
Ideally, when constructing a classification, a taxon can be defined by a number of synapomorphies. However, conflicting evidence frequently exists. Some characters show the relationships of group A to group B, but other characters may show relationships of group A to group C. The principle used to sort out the confusion is that of parsimony: select the hypothesis that explains the most data in the simplest or most economical manner .
With large numbers of characters and large numbers oftaxa, it frequently becomes necessary to utilize computer programs to identify the most parsimonious hypotheses, which may be defined as the hypotheses requiring the fewest number of steps to progress from the outgroup to the terminal taxa on a cladogram. Phylogenetic programs based on parsimony algorithms include Hennig86 (Farris1988), PAUP (phylogenetic analysis using parsimony; Swofford 2003), and NONA (Goloboff 1999). Maximumlikelihood models to infer phylogenies have been programmed(e.g., MrBayes; Ronquist & Huelsenbeck 2003)to handle the enormous amount of data generated from molecular sequences. A thorough explanation of cladistics methodology is presented by Wiley (1981), and cogent, brief summaries can be found in Lundberg and McDade (1990) and Funk (1995).
Cladistic techniques and good classifications based on these techniques have proved particularly useful in analyzing the geographic distribution of plants and animals in aprocess called vicariance biogeography.
Phenetics, or numerical taxonomy, is a second approach to systematics. Phenetics starts with species or other taxa as operational taxonomic units (OTUs) and then clusters the OTUs on the basis of overall similarity, using an array of numerical techniques. Advocates of this school believe that the more characters used the better and more natural the classification should be (Sneath & Sokal 1973). Some of the numerical techniques devised by this school are useful in dealing with masses of data and have been incorporated into cladistics. However, few modern systematists subscribe to the view that using a host of characters, without distinguishing between plesiomorphies and apomorphies,will provide a natural classification. Some molecular systematistsstill use phenetic methods to treat their data. Graphic representations in phenetics, known as phenograms,look like tennis ladders, with OTUs in place of thecompetitors. Relatedness is determined by comparing measured linear distances between OTUs; the closer two unitsare, the more closely related they are.
Evolutionary systematics, as summarized by Mayr(1974), holds that an agenesis, the amount of time and differentiation that have taken place since groups divided, must also be taken into consideration along with cladogenesis, the process of branch or lineage splitting between sister groups. Evolutionary relationships are expressed ona tree called a phylogram. The contrast between cladistics and evolutionary schools can be demonstrated by considering how to classify birds. Cladists emphasize the fact that crocodiles and birds belong to the same evolutionary line by insisting they must be included within a named monophyletic group, Archosauria, in a phylogenetic classification. Evolutionary systematists emphasize the long time gap between fossil crocodilians and modern birds and believe that birds and crocodiles must be treated as separate evolutionary units.
Most leading ichthyological theorists favor the cladistics school and tend to consider any problems resulting from strictly following cladistic theory as minor. On the other hand, many practical ichthyologists, working at the species level, ignore the controversy so they can get on with the business of describing and cataloging ichthyological diversity before humans exterminate large segments of it.
Related Topics