Chapter: Civil : Construction Planning And Scheduling : Organization and Use of Project Information
Accuracy and Use of Information
Accuracy and Use of Information
Numerous sources of error are expected for project
information. While numerical values are often reported to the nearest cent or
values of equivalent precision, it is rare that the actual values are so
accurately known. Living with some uncertainty is an inescapable situation, and
a prudent manager should have an understanding of the uncertainty in different
types of information and the possibility of drawing misleading conclusions.
We have already discussed the uncertainty inherent
in making forecasts of project costs and durations sometime in the future.
Forecast uncertainty also exists in the short term. For example, consider
estimates of work completed. Every project manager is familiar with situations
in which the final few bits of work for a task take an inordinate amount of
time. Unforeseen problems, inadequate quality on already completed work, lack
of attention, accidents, or postponing the most difficult work problems to the
end can all contribute to making the final portion of an activity actually
require far more time and effort than expected. The net result is that
estimates of the actual proportion of work completed are often inaccurate.
Some inaccuracy in reports and estimates can arise
from conscious choices made by workers, foremen or managers. If the value of
insuring accuracy is thought to be low or nonexistent, then a rational worker
will not expend effort or time to gather or to report information accurately.
Many project scheduling systems flounder on exactly this type of non-reporting
or mis-reporting. The original schedule can quickly become extremely misleading
without accurate updating! Only if all parties concerned have specific mandates
or incentives to report accurately will the data be reliable.
Another
source of inaccuracy comes from transcription errors of various sorts.
Typographical errors, incorrect measurements from reading equipment, or other
recording and calculation errors may creep into the sets of information which
are used in project management. Despite intensive efforts to check and
eliminate such errors, their complete eradication is virtually impossible.
One method of indicating the relative accuracy of
numerical data is to report ranges or expected deviations of an estimate or
measurement. For example, a measurement might be reported as 198 ft. + 2
ft. There are two common interpretations of these deviations. First, a range
(such as + 2) might be chosen so that the actual value is certain to be
within the indicated range. In the case above, the actual length would be
somewhere between 196 and 200 feet with this convention. Alternatively, this
deviation might indicate the typical range of the estimate or measurement. In
this case, the example above might imply that there is, say, a two-thirds
chance that the actual length is between
196 and
200.
When the
absolute range of a quantity is very large or unknown, the use of a statistical
standard deviation as a measure of uncertainty may be useful. If a quantity is
measured n times resulting is a set of values xi (i = 1,2,...,n),
then the average or mean value then the average or mean value is given by:
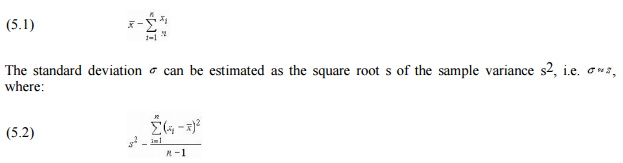
The standard deviation is a direct indicator of the spread or
variability in a measurement, in the same units as the measurement itself.
Higher values of the standard deviation indicate greater and greater
uncertainty about the exact value of the measurement. For the commonly
encountered normal distribution of a random variable, the average value plus or
minus one standard deviation, ![]() +
+ ![]() , will include about two-thirds
ofx the actual occurrences. A related measure of random variability is the
coefficient of variation, defined as the ratio of the standard deviation to the
mean:
, will include about two-thirds
ofx the actual occurrences. A related measure of random variability is the
coefficient of variation, defined as the ratio of the standard deviation to the
mean:
(5.3)
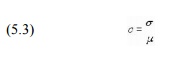
Thus, a coefficient of variation indicates the
variability as a proportion of the expected value. A coefficient of variation
equal to one (c = 1) represents substantial uncertainty, whereas a value such
as c = 0.1 or ten percent indicates much smaller variability.
More generally, even information which is gathered
and reported correctly may be interpreted incorrectly. While the actual
information might be correct within the terms of the data gathering and
recording system, it may be quite misleading for managerial purposes. A few
examples can illustrate the problems which may arise in naively interpreting
recorded information without involving any conceptual understanding of how the
information is actually gathered, stored and recorded or how work on the project
actually proceeds.
Example
5-1: Sources of Delay and Cost Accounts
It is common in construction activity information to make
detailed records of costs incurred and work progress. It is less common to keep
detailed records of delays and their causes, even though these delays may be
the actual cause of increased costs and lower productivity.Paying exclusive
attention to cost accounts in such situations may be misleading. For example,
suppose that the accounts for equipment and material inventories show cost
savings relative to original estimates, whereas the costs associated with
particular construction activities show higher than estimated expenditures. In
this situation, it is not necessarily the case that the inventory function is
performing well, whereas the field workers are the cause of cost overrun
problems. It may be that construction activities are delayed by lack of
equipment or materials, thus causing cost increases. Keeping a larger inventory
of materials and equipment might increase the inventory account totals, but
lead to lower overall costs on the project. Better yet, more closely matching
demands and supplies might reduce delay costs without concurrent inventory cost
increases. Thus, simply examining cost account information may not lead to a
correct diagnosis of a problem or to the correct managerial responses.
Example
5-2: Interest Charges
Financial
or interest charges are usually accumulated in a separate account for projects,
while the accounts associated with particular activities represent actual
expenditures. For example, planning activities might cost $10,000 for a small
project during the first year of a two year project. Since dollar expenditures
have a time value, this $10,000 cost in year 1 is not equivalent in value to a
$10,000 cost in year 2. In particular, financing the early $10,000 involves
payment of interest or, similarly, the loss of investment opportunities. If the
borrowing rate was 10%, then financing the first year $10,000 expenditure would
require $10,000 x 0.10= $1,000 and the value of the expenditure by the end of
the second year of the project would be $11,000. Thus, some portion of the
overall interest charges represents a cost associated with planning activities.
Recognizing the true value of expenditures made at different periods of time is
an important element in devising rational planning and management strategies.
Related Topics