Chapter: Medical Physiology: Cardiac Failure
Quantitative Graphical Method for Analysis of Cardiac Failure
Quantitative Graphical Method for Analysis of Cardiac Failure
Although it is possible to understand most general principles of cardiac failure using mainly qualitative logic, as we have done thus far, one can grasp the importance of the different factors in cardiac failure with far greater depth by using more quantita-tive approaches. One such approach is the graphical method for analysis of cardiac output regulation. In the later sections, we analyze several aspects of cardiac failure, using this graphical technique.
Graphical Analysis of Acute Heart Failure and Chronic Compensation
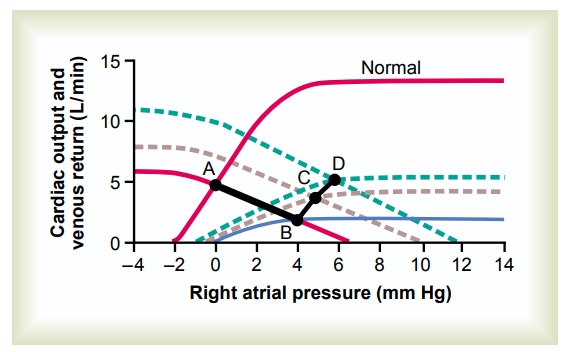
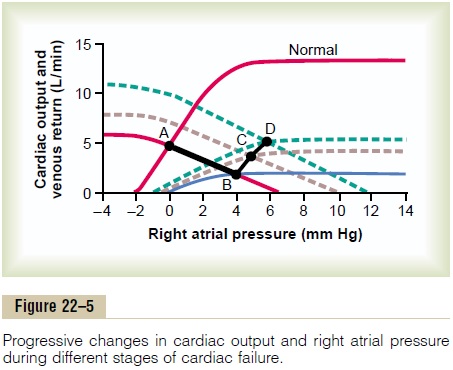
Figure 22–5 shows cardiac output and venous returncurves for different states of the heart and peripheral circulation. The two curves passing through Point A are (1) the normal cardiac output curve and (2) the normal venous return curve. As pointed out, there is only one point on each of these two curves at which the circulatory system can operate. This point is where the two curves cross at point A. Therefore, the normal state of the circulation is a cardiac output and venous return of 5 L/min and a right atrial pressure of 0 mm Hg.
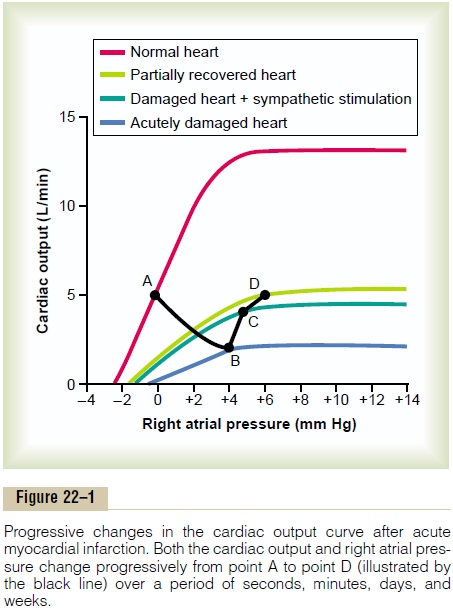
Effect of Acute Heart Attack. During the first few secondsafter a moderately severe heart attack, the cardiac output curve falls to thelowermost curve. During these few seconds, the venous return curve still has not changed because the peripheral circulatory system is still operating normally. Therefore, the new state of the circulation is depicted by point B, where the new cardiac output curve crosses the normal venous return curve. Thus, the right atrial pressure rises immedi-ately to 4 mm Hg, whereas the cardiac output falls to 2 L/min.
Effect of Sympathetic Reflexes. Within the next 30seconds, the sympathetic reflexes become very active. They affect both the cardiac output and the venous return curves, raising both of them. Sympathetic stim-ulation can increase the plateau level of the cardiac output curve as much as 30 to 100 per cent. It can also increase the mean systemic filling pressure (depicted by the point where the venous return curve crosses the zero venous return axis) by several millimeters of mercury—in this figure, from a normal value of 7 mm Hg up to 10 mm Hg. This increase in mean systemic filling pressure shifts the entire venous return curve to the right and upward. The new cardiac output and venous return curves now equilibrate at point C, that is, at a right atrial pressure of +5 mm Hg and a cardiac output of 4 L/min.
Compensation During the Next Few Days. During theensuing week, the cardiac output and venous return curves rise further because of (1) some recovery of the heart and (2) renal retention of salt and water, which raises the mean systemic filling pressure still further— this time up to +12 mm Hg. The two new curves now equilibrate at point D. Thus, the cardiac output has now returned to normal. The right atrial pressure, however, has risen still further to +6 mm Hg. Because the cardiac output is now normal, renal output is also normal, so that a new state of equilibrated fluid balance has been achieved. The circulatory system will continue to function at point D and remain stable, with a normal cardiac output and an elevated right atrial pressure, until some additional extrinsic factor changes either the cardiac output curve or the venous return curve.
Using this technique for analysis, one can see espe-cially the importance of moderate fluid retention and how it eventually leads to a new stable state of the cir-culation in mild to moderate heart failure. And one can also see the interrelation between mean systemic filling pressure and cardiac pumping at various degrees of heart failure.
Note that the events described in Figure 22–5 are the same as those presented in Figure 22–1, but in Figure 22–5, they are presented in a more quantitative manner.
Graphical Analysis of “Decompensated” Cardiac Failure
The black cardiac output curve in Figure 22–6 is the same as the curve shown in Figure 22–2, a very low curve that has already reached a degree of recovery as great as this heart can achieve. In this figure, we have added venous return curves that occur during succes-sive days after the acute fall of the cardiac output
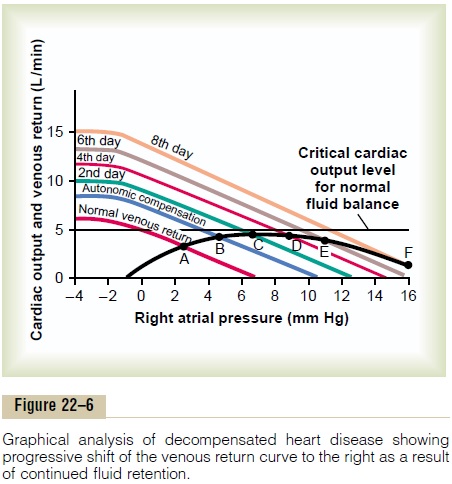
curve to this low level. At point A, the curve at time zero equates with the normal venous return curve to give a cardiac output of about 3 L/min. However, stim-ulation of the sympathetic nervous system, caused by this low cardiac output, increases the mean systemic filling pressure within 30 seconds from 7 to 10.5 mm Hg. This shifts the venous return curve upward and to the right to produce the curve labeled “autonomic compensation.” Thus, the new venous return curve equates with the cardiac output curve at point B. The cardiac output has been improved to a level of 4 L/min but at the expense of an additional rise in right atrial pressure to 5 mm Hg.
The cardiac output of 4 L/min is still too low to cause the kidneys to function normally. Therefore, fluid con-tinues to be retained, and the mean systemic filling pressure rises from 10.5 to almost 13 mm Hg. Now the venous return curve becomes that labeled “2nd day” and equilibrates with the cardiac output curve at point C. The cardiac output rises to 4.2 L/min and the right atrial pressure to 7 mm Hg.
During the succeeding days, the cardiac output never rises quite high enough to re-establish normal renal function. Fluid continues to be retained, the mean systemic filling pressure continues to rise, the venous return curve continues to shift to the right, and the equilibrium point between the venous return curve and the cardiac output curve also shifts progressively to point D, to point E, and, finally, to point F. The equi-libration process is now on the down slope of the cardiac output curve, so that further retention of fluid causes only more severe cardiac edema and a detri-mental effect on cardiac output. The condition accel-erates downhill until death occurs.
Thus, “decompensation” results from the fact that the cardiac output curve never rises to the critical level of 5 L/min needed to re-establish normal kidney excre-tion of fluid that would be required to cause balance between fluid input and output.
Treatment of Decompensated Heart Disease with Digitalis. Letus assume that the stage of decompensation has already reached point E in Figure 22–6, and let us proceed to the same point E in Figure 22–7. At this time, digitalis is given to strengthen the heart. This raises the cardiac output curve to the level shown in Figure 22–7, but there is not an immediate change in the venous return curve. Therefore, the new cardiac output curve equates with the venous return curve at point G. The cardiac output is now 5.7 L/min, a value greater than the critical level of 5 liters required to make the kidneys excrete normal amounts of urine. Therefore, the kidneys eliminate much more fluid than normally, causing diuresis, a well-known therapeutic effect of digitalis.
The progressive loss of fluid over a period of several days reduces the mean systemic filling pressure back down to 11.5 mm Hg, and the new venous return curve becomes the curve labeled “Several days later.” This curve equates with the cardiac output curve of the digitalized heart at point H, at an output of 5 L/min and a right atrial pressure of 4.6 mm Hg. This cardiac
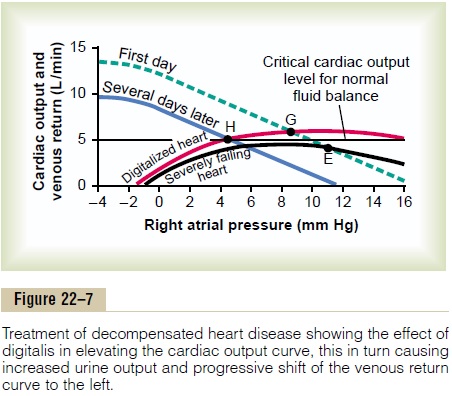
output is precisely that required for normal fluid balance. Therefore, no additional fluid will be lost and none will be gained. Consequently, the circulatory system has now stabilized, or in other words, the decompensation of the heart failure has been “com-pensated.” And to state this another way, the final steady-state condition of the circulation is defined by the crossing point of three curves: the cardiac output curve, the venous return curve, and the critical level for normal fluid balance. The compensatory mecha-nisms automatically stabilize the circulation when all three curves cross at the same point.
Graphical Analysis of High-Output Cardiac Failure
Figure 22–8 gives an analysis of two types of high-output cardiac failure. One of these is caused by an arteriovenous fistula that overloads the heart becauseof excessive venous return, even though the pumping capability of the heart is not depressed. The other is caused by beriberi, in which the venous return is greatly increased because of diminished systemic vas-cular resistance, but at the same time, the pumping capability of the heart is depressed.
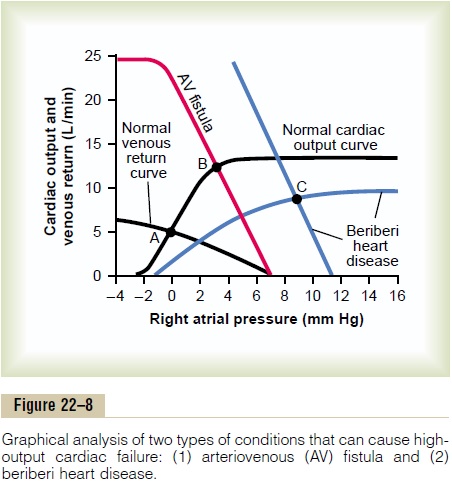
Arteriovenous Fistula. The “normal” curves of Figure22–8 depict the normal cardiac output and normal venous return curves. These equate with each other at point A, which depicts a normal cardiac output of 5 L/ min and a normal right atrial pressure of 0 mm Hg.
Now let us assume that the systemic resistance (the total peripheral resistance) becomes greatly decreasedbecause of opening a large arteriovenous fistula (a direct opening between a large artery and a large vein). The venous return curve rotates upward to give the curve labeled “AV fistula.” This venous return curve equates with the normal cardiac output curve at point B, with a cardiac output of 12.5 L/min and a right atrial pressure of 3 mm Hg. Thus, the cardiac output has become greatly elevated, the right atrial pressure is slightly elevated, and there are mild signs of periph-eral congestion.
If the person attempts to exercise, he or she will have little cardiac reserve because the heart is already being used almost to maximum capacity to pump the extra blood through the arteriovenous fistula. This condition resembles a failure condition and is called “high-output failure,” but in reality, the heart is overloaded by excess venous return.
Beriberi. Figure 22–8 shows the approximate changesin the cardiac output and venous return curves caused by beriberi. The decreased level of the cardiac output curve is caused by weakening of the heart because of the avitaminosis (mainly lack of thiamine) that causes the beriberi syndrome. The weakening of the heart has decreased the blood flow to the kidneys. Therefore, the kidneys have retained a large amount of extra body fluid, which in turn has increased the mean systemic filling pressure (represented by the point where the venous return curve now intersects the zero cardiac output level) from the normal value of 7 mm Hg up to 11 mm Hg. This has shifted the venous return curve to the right. Finally, the venous return curve has rotated upward from the normal curve because the avita-minosis has dilated the peripheral blood vessels.
The two blue curves (cardiac output curve and venous return curve) intersect with each other at point C, which describes the circulatory condition in beriberi, with a right atrial pressure in this instance of 9 mm Hg and a cardiac output about 65 per cent above normal; this high cardiac output occurs despite the weak heart, as demonstrated by the depressed plateau level of the cardiac output curve.
Related Topics