Chapter: Fundamentals of Database Systems : Advanced Database Models, Systems, and Applications : Introduction to Information Retrieval and Web Search
Evaluation Measures of Search Relevance
Evaluation Measures of Search Relevance
Without proper evaluation
techniques, one cannot compare and measure the relevance of different retrieval
models and IR systems in order to make improvements.
Evaluation techniques of IR systems measure the topical relevance and user
relevance. Topical relevance measures the extent to which the topic
of a result matches the topic of the
query. Mapping one’s information need with “perfect” queries is a cognitive
task, and many users are not able to effectively form queries that would
retrieve results more suited to their information need. Also, since a major
chunk of user queries are informational in nature, there is no fixed set of
right answers to show to the user. User
relevance is a term used to describe the “goodness” of a retrieved result
with regard to the user’s information need. User relevance includes other
implicit factors, such as user perception, context, timeliness, the user’s
environment, and current task needs. Evaluating user relevance may also involve
subjective analysis and study of user retrieval tasks to capture some of the
properties of implicit factors involved in accounting for users’ bias for
judging performance.
In Web information retrieval, no binary classification decision is made
on whether a document is relevant or nonrelevant to a query (whereas the
Boolean (or binary) retrieval model uses this scheme, as we discussed in Section
27.2.1). Instead, a ranking of the documents is produced for the user.
Therefore, some evaluation measures focus on comparing different rankings
produced by IR systems. We discuss some of these measures next.
1. Recall and Precision
Recall
and precision metrics are based on the binary relevance assumption (whether
each document is relevant or nonrelevant to the query). Recall is defined as the number of relevant documents retrieved by
a search divided by the total number of existing relevant documents. Precision is defined as the number of
relevant documents retrieved by a search divided by the total number of
documents retrieved by that search. Figure 27.5 is a pictorial representation
of the terms retrieved vs. relevant and shows how search results
relate to four different sets of documents.
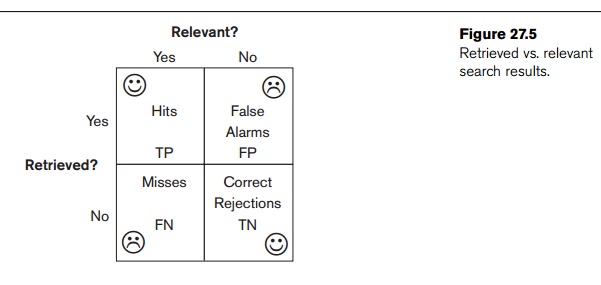
The
notation for Figure 27.5 is as follows:
TP: true positive
FP: false positive
FN: false negative
TN: true negative
The terms
true positive, false positive, false
negative, and true negative are
generally used in any type of classification tasks to compare the given
classification of an item with the desired correct classification. Using the
term hits for the documents that
truly or “correctly” match the user request, we can define:
Recall =
|Hits|/|Relevant|
Precision
= |Hits|/|Retrieved|
Recall
and precision can also be defined in a ranked retrieval setting. The Recall at
rank position i for document diq (denoted by r(i))
(diq is the
retrieved document at position i for
query q) is the fraction of relevant
documents from d1q to diq in the result set for the query. Let the
set of relevant documents from d1q to diq in that set be Si with cardinality | Si |. Let (|Dq|
be the size of relevant documents for the query. In this case,|Si | ≤ |Dq|). Then:
Recall r(i) = |Si |/|Dq|
The
Precision at rank position i or
document diq
(denoted by p(i)) is the fraction of documents from d1q
to diq in the
result set that are relevant:
Precision p(i) = |Si |/i
Table
27.2 illustrates the p(i), r(i), and average precision (discussed in
the next section) metrics. It can be seen that recall can be increased by
presenting more results to the user, but this approach runs the risk of
decreasing the precision. In the
Table 27.2 Precision and Recall for Ranked Retrieval
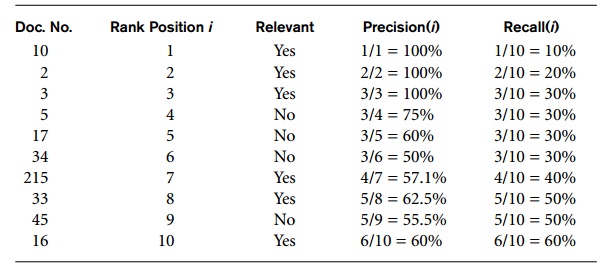
example,
the number of relevant documents for some query = 10. The rank posi-tion and
the relevance of an individual document are shown. The precision and recall
value can be computed at each position within the ranked list as shown in the
last two columns.
2. Average Precision
Average
precision is computed based on the precision at each relevant document in the
ranking. This measure is useful for computing a single precision value to
com-pare different retrieval algorithms on a query q.
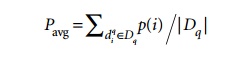
Consider
the sample precision values of relevant documents in Table 27.2. The aver-
age
precision (Pavg value) for the example in Table 27.2 is P(1) + P(2) + P(3) + P(7) + P(8) + P(10)/6 = 79.93
percent (only relevant documents are considered in this calculation). Many good
algorithms tend to have high top-k average precision for small values of k,
with correspondingly low values of recall.
3. Recall/Precision
Curve
A recall/precision curve can be drawn based on the recall and precision
values at each rank position, where the x-axis is the recall and the y-axis is
the precision. Instead of using the precision and recall at each rank position,
the curve is commonly plotted using recall levels r(i) at 0 percent, 10
percent, 20 percent...100 per-cent. The curve usually has a negative slope,
reflecting the inverse relationship between precision and recall.
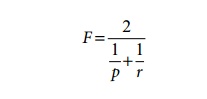
4. F-Score
F-score (F) is the harmonic
mean of the precision (p) and recall
(r) values. High precision is achieved
almost always at the expense of recall and vice versa. It is a matter of the
application’s context whether to tune the system for high precision or high
recall. F-score is a single measure that combines precision and recall to
compare different result sets:
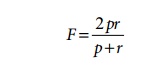
One of the properties of harmonic mean is that the harmonic mean of two
numbers tends to be closer to the smaller of the two. Thus F is automatically biased toward the smaller of the precision and
recall values. Therefore, for a high F-score, both precision and recall must be
high.
Related Topics