Chapter: Power Quality : Introduction to Power Quality
Computer Business Equipment Manufactures Associations(CBEMA) and ITI Curves
CBEMA and ITI Curves:
ü One of
the most frequently employed displays of data to represent the power quality is
the so-called CBEMA curve.
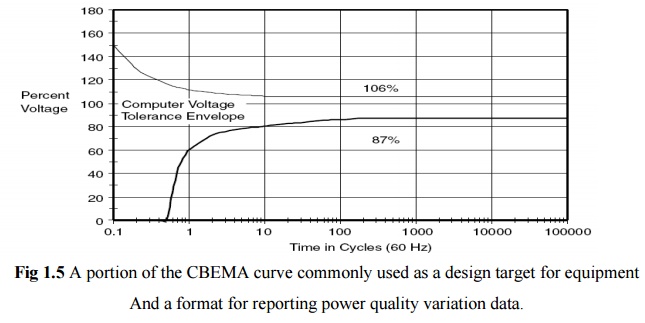
ü A portion
of the curve adapted from IEEE Standard 4469 that we typically use in our
analysis of power quality monitoring results is shown in Fig. 1.5.
ü This
curve was originally developed by CBEMA to describe the tolerance of mainframe
computer equipment to the magnitude and duration of voltage variations on the
power system.
ü While
many modern computers have greater tolerance than this, the curve has become a
standard design target for sensitive equipment to be applied on the power
system and a common format for reporting power quality variation data.
ü The axes
represent magnitude and duration of the event. Points below the envelope are
presumed to cause the load to drop out due to lack of energy. Points above the
envelope are presumed to cause other malfunctions such as insulation failure,
overvoltage trip, and over excitation.
ü The upper
curve is actually defined down to 0.001 cycle where it has a value of about 375
percent voltage.
ü We
typically employ the curve only from 0.1 cycles and higher due to limitations
in power quality monitoring instruments and differences in opinion over
defining the magnitude values in the sub cycle time frame.
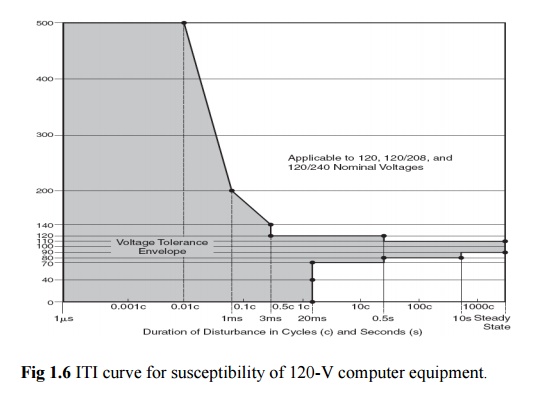
The CBEMA
organization has been replaced by ITI, and a modified curve has been developed
that specifically applies to common 120-V computer equipment (see Fig. 1.6).
The concept is similar to the CBEMA curve. Although developed for 120-V
computer equipment, the curve has been applied to general power quality
evaluation like its predecessor curve.
ü Both
curves are used as a reference in this book to define the withstand capability
of various loads and devices for protection from power quality variations.
ü For
display of large quantities of power quality monitoring data, we frequently add
a third axis to the plot to denote the number of events within a certain
predefined cell of magnitude and duration.
Related Topics