Chapter: Medicine Study Notes : Public Health
Biostatistics
Biostatistics
·
Choosing study subjects:
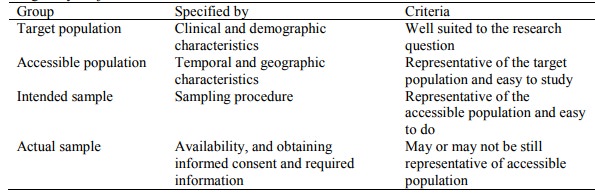
o Populations may be people, institutions, records or events
o Sampling frame is a complete list of individuals in the accessible
population
o A sampling procedure is used to select a representative intended sample
from the sample frame
·
Avoiding systematic errors:
o Trying to use sample mean to estimate the population mean
o Statistic = parameter + bias + confounding bias + chance
o Statistic: summary measure in a sample
o Parameter: underlying value in the target population
o Bias or Confounding ® ¯internal validity
o External validity is whether the study can be applied to the population
I‟m interested in – is it similar enough to the study population?
· Bias:
o Bias = systematic deviation between the statistic and the parameter, due
to defect in the design, conduct or interpretation
o Occurs predominantly in design and data collection
o Selection bias: systematic error due to those who were selected and those who were not, so sample not representative of the defined population
o Information bias: a flaw in measurement exposures or outcomes that results in a differential quality of information between sub-groups/individuals.
§ Misclassification bias: Subjects erroneously categorised. If a random bias then ¯ association in results and odds ratio moves towards 1
§ Interviewer bias: systematic difference in soliciting, recording and interpreting of responses (¯ by training the interviewers – always check this has been done)
§ Recall bias: should be < 2 weeks for health events. Diet recall ~ 24 hours. If not random (eg case-control studies) then biased (eg if cases taken from records then there is variability in what was asked and recorded, verses uniform questionnaire for controls)
o Response bias: systematic error due to differences between those who
volunteer and those who do not (eg bias from drop-outs and non-responders)
o See Topic: EBM Glossary, for further examples of bias
o Confounding bias:
§ A measure of the effect of an exposure on the risk of an outcome is
distorted by an association of the exposure with other factors that influence
the outcome
§ Standard ones: age, gender, ethnicity, socio-economic status, obesity,
smoking, alcohol
§ As long as you collect data about the confounding factor, you can do
something about it
§ Can control for confounding using matching, logistic regression or
stratifying data
·
Chance effect:
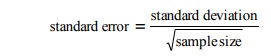
§ Quantifies the precision with which the sample mean estimates the
population mean
§ Says NOTHING about variability in the data
o Confidence interval:
§ Turns standard error into something we can interpret: sample mean +/-
1.96 * standard error
§ 95% sure the underlying value lies in the range
§ Width is dependent on:
· Variation in observed data
·
The sample size (larger sample ® narrower
confidence interval ® more precise estimate)
·
Degree of confidence we want
§ Accuracy depends on presence or absence of bias
o Tests of significance:
§ Tests of significance are a tool for statistical inference
§ Test compatibility of a set of data with the null-hypothesis: assume there is no difference between the means – what is the probability we would observe a difference as big by chance
§ P value: the probability of getting a value at least as extreme as the observed statistic. Threshold usually 0.05
§ Most common test statistics are chi-squared and t-statistic (compares two means). Both depend on degrees of freedom
o Power: = probability that the study will find a statistically significant
difference if a true difference of a given size exists
·
Data:
o Qualitative: not numeric (eg hair colour)
o Quantitative: can be continuous or discrete
o Measurement scales can be nominal (categorical and unordered), ordinal
(categorical and ordered) or interval (continuous)
o Data description:
§ Categorical and discrete date: bar graphs, frequency distributions
§ Continuous data: histograms, frequency polygons
§ Central tendency: Mean or median (best measure of central tendency if
skewed distribution)
§ Spread/variability: Standard deviation, percentiles or inter-quartile
range
§ Correlation co-efficiency – degree of clustering around a straight line
§ If two variables are categorical and unordered then use relative risks
and odds ratios
Related Topics