Chapter: Digital Signal Processing : Frequency Transformations
Application of Discrete Fourier Transform(DFT)
APPLICATION OF DFT
1.
DFT FOR LINEAR FILTERING
Consider that input sequence x(n) of Length L
& impulse response of same system is h(n) having M samples. Thus y(n)
output of the system contains N samples where N=L+M-1. If DFT of y(n) also
contains N samples then only it uniquely represents y(n) in time domain.
Multiplication of two DFT s is equivalent to circular convolution of
corresponding time domain sequences. But the length of x(n) & h(n) is less
than N. Hence these sequences are appended with zeros to make their length N
called as “Zero padding”. The N point circular convolution and linear
convolution provide the same sequence. Thus linear convolution can be obtained
by circular convolution. Thus linear filtering is provided by DFT.
When the input data sequence is long then it
requires large time to get the output sequence. Hence other techniques are used
to filter long data sequences. Instead of finding the output of complete input
sequence it is broken into small length sequences. The output due to these
small length sequences are computed fast. The outputs due to these small length
sequences are fitted one after another to get the final output response.
METHOD
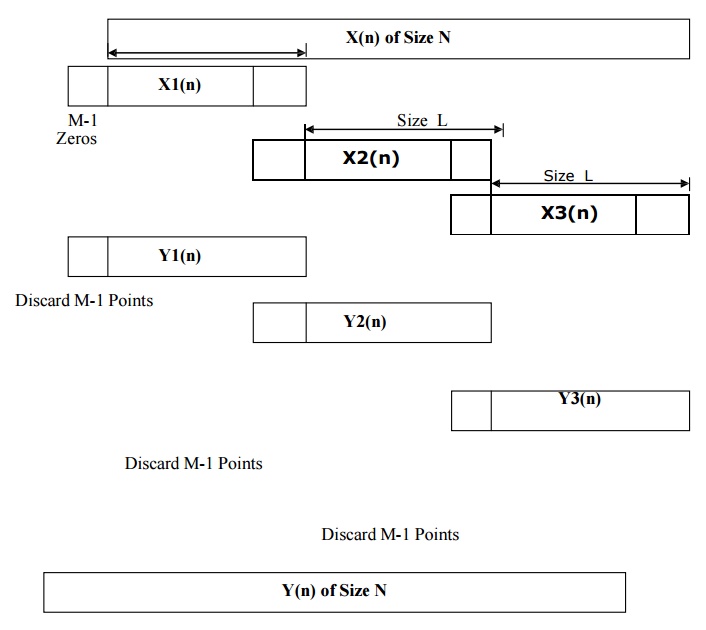
1: OVERLAP SAVE METHOD OF LINEAR FILTERING
Step 1> In this method L samples of the
current segment and M-1 samples of the previous segment forms the input data
block. Thus data block will be
X1(n) ={0,0,0,0,0,…………………
,x(0),x(1),…………….x(L-1)}
X2(n) ={x(L-M+1),
…………….x(L-1),x(L),x(L+1),,,,,,,,,,,,,x(2L-1)} X3(n) ={x(2L-M+1),
…………….x(2L-1),x(2L),x(2L+2),,,,,,,,,,,,,x(3L-1)}
Step2> Unit sample response h(n) contains M
samples hence its length is made N by padding zeros. Thus h(n) also contains N
samples.
h(n)={ h(0), h(1), …………….h(M-1),
0,0,0,……………………(L-1 zeros)}
Step3> The N point DFT of h(n) is H(k) &
DFT of mth data block be xm(K) then corresponding DFT of output be
Y`m(k)
Y`m(k)=
H(k) xm(K)
Step 4> The sequence ym(n) can be obtained by taking N point IDFT of Y`m(k). Initial (M-1) samples in the corresponding data block must be discarded. The last L samples are the correct output samples. Such blocks are fitted one after another to get the final output.
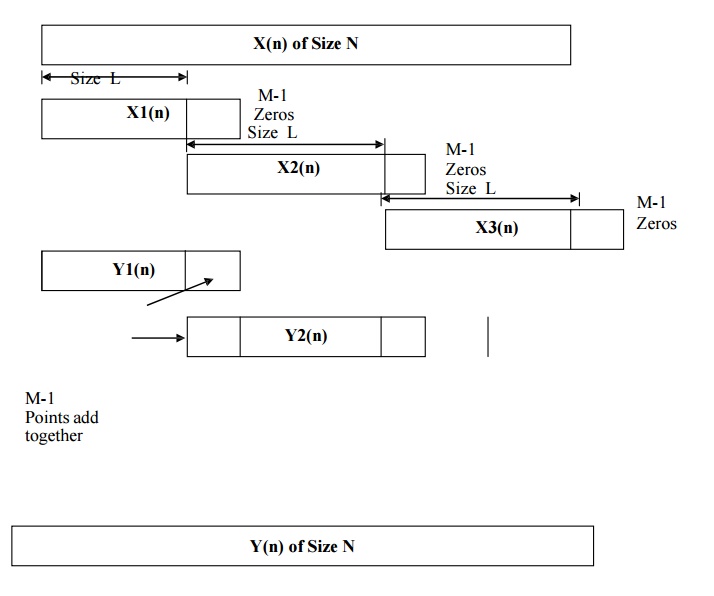
METHOD 2: OVERLAP ADD METHOD OF LINEAR FILTERING
Step
1> In this method L samples of the current segment and M-1 samples of the
previous segment forms the input data block. Thus data block will be
X1(n)
={x(0),x(1),…………….x(L-1),0,0,0,……….}
X2(n)
={x(L),x(L+1),x(2L-1),0,0,0,0}
X3(n)
={x(2L),x(2L+2),,,,,,,,,,,,,x(3L-1),0,0,0,0}
Step2>
Unit sample response h(n) contains M samples hence its length is made N by
padding zeros. Thus h(n) also contains N samples.
h(n)={
h(0), h(1), …………….h(M-1), 0,0,0,……………………(L-1 zeros)}
Step3>
The N point DFT of h(n) is H(k) & DFT of mth data block be xm(K)
then corresponding DFT of output be Y`m(k)
Y`m(k)=
H(k) xm(K)
Step
4> The sequence ym(n) can be obtained by taking N point IDFT of Y`m(k).
Initial (M-1) samples are not discarded as there will be no aliasing. The last
(M-1) samples of current output block must be added to the first M-1 samples of
next output block. Such blocks are fitted one after another to get the final
output.
DIFFERENCE BETWEEN OVERLAP SAVE AND OVERLAP ADD
METHOD
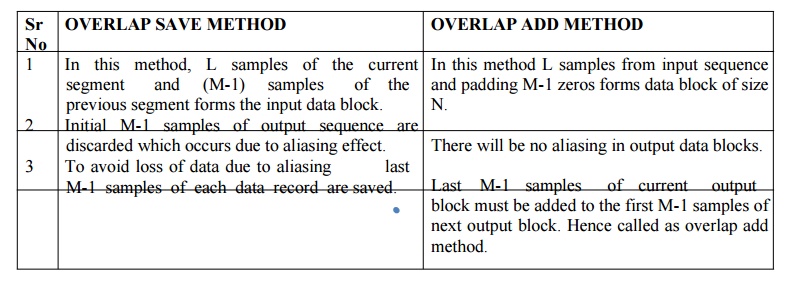
OVERLAP SAVE METHOD
1. In this
method, L samples
of the current segment and (M-1) samples of the
previous segment forms the input data block.
2. Initial M-1 samples of output
sequence are discarded which occurs due to aliasing effect.
3. To avoid loss of data due to
aliasing last M-1 samples of each data record are saved.
OVERLAP
ADD METHOD
1. In this method L samples from
input sequence and padding M-1 zeros forms data block of size N.
2. There will be no aliasing in
output data blocks.
3. Last M-1
samples of current
output block must be added to the first M-1 samples of next output
block. Hence called as overlap add method.
2.
SPECTRUM ANALYSIS USING DFT
DFT of the signal is used for
spectrum analysis. DFT can be computed on digital computer or digital signal processor.
The signal to be analyzed is passed through anti-aliasing filter and samples at
the rate of Fs≥ 2 Fmax. Hence highest frequency component is Fs/2.
Frequency spectrum can be plotted by
taking N number of samples & L samples of waveforms. The total frequency
range 2∏ is divided into N points. Spectrum is better if we take large value of
N & L But this increases processing time. DFT can be computed quickly using
FFT algorithm hence fast processing can be done. Thus most accurate resolution
can be obtained by increasing number of samples.
Related Topics