Chapter: 11th 12th std standard Indian Economy Economic status Higher secondary school College
Statistical Analysis : Classification of Data
Classification of Data
Classification is the process of arranging the collected data into classes and to subclasses according to their common characteristics. Classification is the grouping of related facts into classes. E.g. sorting of letters in post office
Types of classification
There are four types of classification. They are
Geographical classification
Chronological classification
Qualitative classification
Quantitative classification
(i) Geographical classification
When data are classified on the basis of location or areas, it is called geographical classification
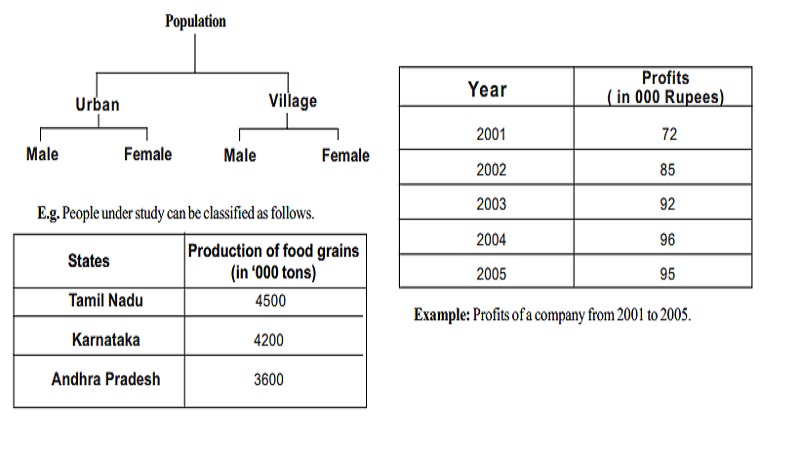
Example: Classification of production of food grains in different states in India.
States Production of food grains
(in '000 tons)
Tamil Nadu 4500
Karnataka 4200
Andhra Pradesh 3600
(ii) Chronological classification
Chronological classification means classification on the basis of time, like months, years etc.
Year Profits
( in 000 Rupees)
2001 72
2002 85
2003 92
2004 96
2005 95
Example: Profits of a company from 2001 to 2005.
Profits of a company from 2001 to 2005
(iii) Qualitative classification
In Qualitative classification, data are classified on the basis of some attributes or quality such as sex, colour of hair, literacy and religion. In this type of classification, the attribute under study cannot be measured. It can only be found out whether it is present or absent in the units of study.
(iv) Quantitative classification
Quantitative classification refers to the classification of data according to some characteristics, which can be measured such as height, weight, income, profits etc.
Example: The students of a school may be classified according to the weight as follows
Weight (in kgs) No of Studemts
40-50 50
50-60 200
60-70 300
70-80 100
80-90 30
90-100 20
Total 700
There are two types of quantitative classification of data. They are
Discrete frequency distribution
Continuous frequency distribution
In this type of classification there are two elements (i) variable (ii) frequency
Variable
Variable refers to the characteristic that varies in magnitude or quantity. E.g. weight of the students. A variable may be discrete or continuous.
Discrete variable
A discrete variable can take only certain specific values that are whole numbers (integers). E.g. Number of children in a family or Number of class rooms in a school.
Continuous variable
A Continuous variable can take any numerical value within a specific interval.
Example: the average weight of a particular class student is between 60 and 80 kgs.
Frequency
Frequency refers to the number of times each variable gets repeated.
For example there are 50 students having weight of 60 kgs. Here 50 students is the frequency.
Frequency distribution
Frequency distribution refers to data classified on the basis of some variable that can be measured such as prices, weight, height, wages etc.
The following are the two examples of discrete and continuous frequency distribution
The following technical terms are important when a continuous frequency distribution is formed
Class limits: Class limits are the lowest and highest values that can be included in a class. For example take the class 40-50. The lowest value of the class is 40 and the highest value is 50. In this class there can be no value lesser than 40 or more than 50. 40 is the lower class limit and 50 is the upper class limit.
Class interval: The difference between the upper and lower limit of a class is known as class interval of that class. Example in the class 40-50 the class interval is 10 (i.e. 50 minus 40).
Class frequency: The number of observations corresponding to a particular class is known as the frequency of that class
Example:
Income (Rs) No. of persons
1000 - 2000 50
In the above example, 50 is the class frequency. This means that 50 persons earn an income between Rs.1, 000 and Rs.2, 000.
(iv) Class mid-point: Mid point of a class is formed out as follows.
Tabulation of Data
A table is a systematic arrangement of statistical data in columns and rows. Rows are horizontal arrangements whereas the columns are vertical ones.
Related Topics