Chapter: Automation, Production Systems, and Computer Integrated Manufacturing : Group Technology and Cellular Manufacturing
Production Flow Analysis
PRODUCTION FLOW ANALYSIS
This is
an approach to part family identification and machine cell formation that was
pioneered by J. Burbidge [6][R]. Production
flow analysis (PFA) is a method for identifying part families and
associated machine groupings that uses the information contained 011 production
route sheets rather than on part drawings. Work parts with identical or similar
routings are classified into part families. These families can then be used to
form logical machine cells in a group technology layout. Since PFA uses
manufacturing data rather than design data to identify part families, it can
overcome two possible anomalies that can occur in parts classification and
coding. First, parts whose basic geometries are quite different may
nevertheless require similar or even identical process routings. Second, parts
whose geornetries are quite similar may nevertheless require process routings
that are quite different.
The
procedure in production flow analysis must begin by defining the scope of the
study, which means deciding on the population of parts to be analyzed. Should
all of the parts in the shop be Included in the study, or should a
representative sample be selected for analysis! Once this decision is made,
then the procedure in PFA consists of the following steps:
Data collection. The minimum data needed in the
analysis are the part number and operation
sequence, which is contained in shop documents called route sheets or operation
sheets or some similar name. Each operation is usually associated with a
particular machine, so determining the operation sequence also determines the
machine sequence. Additional data. such as lot size, time standards, and annual
demand might be useful for designing machine cells of the required production
capacity.
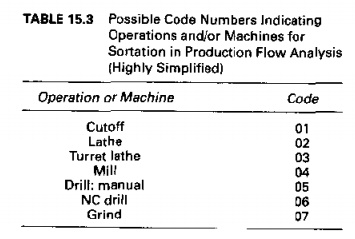
Soriation
of process routings. In this step, the parts are arranged into groups
according to the similarity of their process routings. To facilitate this step,
all operations or machines included in the shop are reduced to code numbers,
such as those shown in Table 15.3. For each part, the operation codes are
listed in the order in which they are performed. A sortation procedure is then
used to arrange parts into "packs," which are groups of parts with
identical routings. Some packs may contain only one part number, indicating the
uniqueness of the processing of that part. Other packs will contain many parts,
and these will constitute a part family.
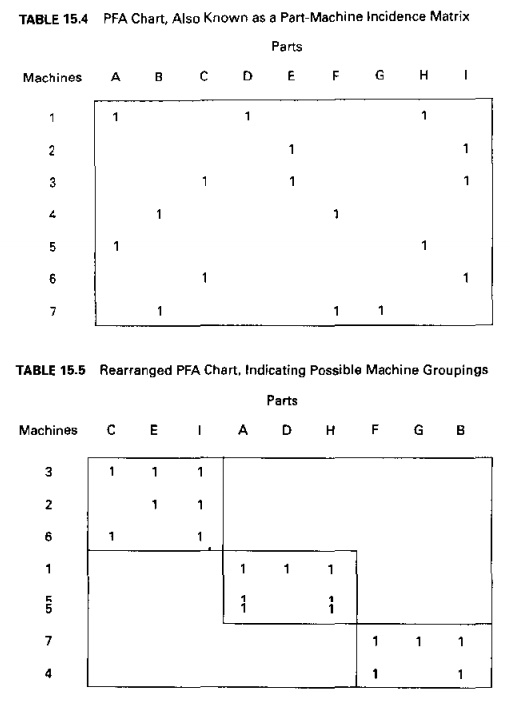
PFA
chart. The processes used for each pack are then displayed in a PFA chart, a simplified
example of which is illustrated in Table 15.4.1 The chart is a tabulation of the
process or machine code numbers for all of the part packs. In recent GT
literature [30], the PFA chart has been referred to as part-machine incidence matrix. In this matrix, the entries have a
value xii=1 or 0: a value of xij = 1 indicates that the
corresponding part i requires
processing on machine j, and X'I = 0
indicates that no processing of component i
is accomplished on machine j. For clarity of presenting the
matrix, the D's are often indicated as blank (empty) entries, as in our table.
Cluster
analysis. From the pattern of data in the PFA chart. related groupings are identified and rearranged into a new
pattern that brings together packs with similar machine sequences. One possible
rearrangement of the original PFA chart is shown in Table 15.5, where different
machine groupings are indicated within blocks. The blocks might be considered
as possible machine cells. It is often the case (but not in Table 15.5) that
some packs do not fit into logical groupings. These parts might be analyzed to
see if a revised process sequence can be developed that fits into one of the
groups. If not, these parts must continue to be fabricated through a
conventional process layout. In Section 15.6.1, we examine a systematic
technique called rank order clustering that can be used to perform
the cluster analysis.
TABLE 15.3
Possible Code Numbers indicating Operations and/or Machines for
Sortation in Production Flow Analysis (Highly Simplified)
The
weakness of production flow analysis is that the data used in the technique are
derived from existing production route sheets. In all likelihood, these route sheets have been prepared by
different process planners, and the routings may contain operations that are
non optimal, illogical, or unnecessary. Consequently, the final machine
groupings obtained in the analysis may be suboptimal. Notwithstanding this
weakness, PFA has the virtue of requiring less time than a complete parts
classification and coding procedure. This virtue is attractive to many firms
wishing to introduce group technology into their plant operations.
Related Topics