Chapter: Pharmaceutical Drug Analysis: Potentiometric Methods
Potentiometric Methods: Theory
THEORY
In a situation, where a metal M is placed in a solution
containing its own ions Mn+,
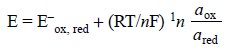
an electrode potential is established across the two electrodes, whose actual
value is provided by the Nernst equation as shown below :
E = E– + (RT/nF) 1n a Mn+ ..(b)
From Eq. (b)
the relationship to a cationic electrode, i.e.,
sensitive only to a cation concentration, may be expressed as :
E = E– Yn+,
Y + (RT/nF) 1n aYn+.........................(c)
to an anionic electrode :
E = E– Xn–,
X – (RT/nF) 1n a Xn–.........................(d)
or to a redox electrode :
 ..........................(e)
where,
E– = Standard electrode potential (SEP) (or reduction potential of the half-cell
involved),
a = Thermodynamic activity of the ion to which the
electrode is sensitive,
R = Gas constant (8.314 JK–1 mol–1),
T = Absolute temperature (K),
F = Faraday (96500 C/mole of electrons), and
n = Number of electrons involved in the electrode
reaction.
Direct Potentiometry : The procedure adopted of
employing a single measurement of electrode
potential to determine the concentration of an ionic species in a solution
is usually termed as direct potentiometry.
Disadvantages : Direct potentiometry has the
following two serious
disadvantages namely :
(a) From the Nernst Eq. (b) : Considering n = 1, temperature 25°C, RT/nF being a constant, and introducing the
factor for the conversion of natural logarithms to logarithms to base 10, the
term RT/nF shows a value of 0.0591 V.
Therefore, for an ion M+ (monovalent) a ten-time change in the
electrode potential E by approximately 60 millivolts (mV) ; whereas for an ion
M2+ (bivalent) a change in identical magnitude of activity shall
bring forth alternation of E by about 30 mV. Hence, it is evident that to
attain a desired accuracy and precision to the extent of 1% in the estimated
value for the direct concentration using the technique of direct potentiometry,
for M+ ion—the E should be measurable correctly within 0.26 mV ; and
for M2+ ion-within 0.1 mV.
(b) Uncertainty due to liquid-junction
potential (Ej) : It has been observed that the liquid-junction
potential (Ej) occurring
between the two solutions, one related to the reference-electrode and the other
to the indicator-electrode gives rise to a certain quantum of uncertainty with
regard to e.m.f. measurement.
Remedial Measures : There are two ways to eliminate the above anomaly, namely :
(i)
to replace the reference electrode with a
concentration-cell i.e., with an
electrode comprised of a rod of the same metal as that employed in the
indicator electrode plus a solution having the same cation as present in the
test-solution, but with a known concentration. Thus, the ionic activity of the
metal ion present in the test-solution may be represented by the following
expression :
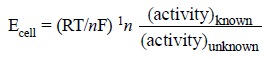 ....................(f)
(ii) by using
one solution which contains a high concentration of KCl or NH4NO3
i.e., such electro-lytes that offer
almost identical values for ionic conductivities for both cation as well as
anion.
Keeping in view the above serious anomalies commonly
encountered with direct potentiometry, such as : an element of uncertainty
triggered by liquid junction potential (Ej)
and high degree of sensitivity required to measure electrode potential (E), it
promptly gave birth to the phenomenon of potentiometric titrations,
which subsequently received a high level of
sophistication and ultimately turned into a versatile analytical method. As the
name suggests, it is indeed a titrimetric method whereby a series of
potentiometric measurements are recorded so as to locate the end-point as
correctly as possible. In this procedure, it is particularly of more interest
to know the exact changes in the observed electrode potential after each
addition of the titrant, rather than a precise and accurate electrode potential
often brought about by a given solution. Thus, in a way the impact due to
liquid-junction-potential (Ej)
has been eliminated completely. It is pertinent to mention here that in a
potentiometric titration procedure the apparent change in cell e.m.f. takes
place not only most rapidly but also most distinctly in the vicinity of the
end-point.
1. GENERAL CONSIDERATIONS
The potentiometric titrations invariably cover a
broad-spectrum of chemical reactions that may be classified as follows :
(i)
Neutralization reactions,
(ii) Redox
reactions,
(iii)
Precipitation reactions,
(iv)
Complexation reactions, and
(v)
Potentiometric titrations in non-aqueous solvents.
The general principles which govern the above different
types of reactions will be discussed briefly in the sections that follow :
1.1. Neutralization Reactions
The accuracy and precision with which the end-point can
be determined potentiometrically solely depends upon the quantum of change in
the observed e.m.f. in the vicinity of the equivalence point, which in turn
entirely depends upon the strength and the concentration of acid and base
employed.
Merits of the Method : It is found to be useful to
titrate a mixture of acids having a significant difference in their strengths, for instance : HCl and CH3COOH
(alcoholic). In this case, the first-break in the titration curve signifies
that the stronger of the two acids i.e.,
HCl, gets neutralized ; whereas, the second-break represents the entire
completion (i.e., HCl + CH3COOH).
In order to get fruitful and reproducible results it is
quite necessary that the strengths between either the two acids or bases in
question must vary by at least 105 to 1.
Demerits of the Method : The neutralization reactions
often found to be giving unsatisfactory results in the following two
instances. They are :
(a) when both
the acid and the base are appreciably weak, and
(b) when either
the acid or the base is very weak (i.e.,
K < 10–8) and also the prevailing solutions are dilute.
Note : In (a) above, an accuracy upto 1% is achievable in 0.1 M solution.
Choice of Electrodes :
Indicator Electrodes : Hydrogen, Glass or Antimony
electrodes ;
Reference Electrode : Calomel electrode.
1.2. Redox Reactions
In this particular case the ratio of the concentrations
of the oxidized and reduced forms of ionic species establishes the determining
factor. Considering the following reaction,

The electrode potential E is given by the following
expression :
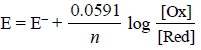 .....................(g)
where, E– = Standard potential of the system.
In other words, the potential of the immersed indicator
electrode is solely controlled and monitored by the ratio of the ionic
concentrations in Eq. (g).
Furthermore, in the course of either reduction of an oxidizing agent or vice-versa i.e. the said ratio, and
hence the observed potential, undergoes an instant rapid change in the
proximity of the end-point of the redox reaction.
Example : A typical example is that of
titrations of Fe2+ with potassium permanganate or
potassium dichromate or cerium (IV) sulphate.
Choice of Electrode : Indicator Electrode : Pt wire
or foil.
The oxidizing agent is usually taken in the burette.
1.3. Precipitation Reactions
In this the determining factor mainly rests on the
solubility product of the resulting nearly insoluble material generated in the
course of a precipitation reaction and its ionic concentration at the
equivalence point. It is, however, pertinent to mention here that the indicator
electrode must readily come into equilib-rium with one of the ions.
Example : Titration of Ag+ with
a halide (Cl–, Br– or I–) or with SCN– (thiocyanate
ion).
Choice of Electrodes :
Reference Electrodes : Saturated Calomel Electrode (SCE) :
Silver-silver chloride Electrode ;
Indicator Electrodes : Silver wire or Platinum wire or gauze plated with silver and
sealed into a glass-tube.
(It should readily come into equilibrium with one of the
ions of the precipitate).
Salt-Bridge : For the determination of a halide the
salt-bridge should be a saturated solution of potassium nitrate.
Note : Ion-selective electrode can
also be employed.
1.4. Complexation Reaction
Complexation invariably occurs by the interaction of a
sparingly soluble precipitate with an excess amount of the reagent, for
instance : the classical example of titration between KCN and AgNO3
as expressed by the following reactions :
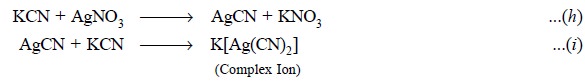
In Eq. (h) the
precipitate of AgCN is produced at first instance ; consequently, the
precipitate of AgCN initially produced gets dissolved by further addition of
KCN to afford the complex ion [Ag(CN)2]– Eq. (i) and only a negligible quantum of Ag+
ions remain in the solution. Thus, the entire process from ab initio to the final
stage of titration may be divided into
three distinct portions, namely :
(i) Upto end-point : Here, all the
available CN– ion has been virtually converted to the complex ion.
At this stage the ever increasing concentration reflects a gradually increasing
concentration of Ag+ ions, thereby slowly enhancing the potential of
the Ag-electrode dipping in the solution,
(ii) At the end-point : It is usually
visualized by a distinct and marked rise in potential, and (iii) Beyond end-point : Further addition of AgNO3 brings
about only a gradual change in e.m.f. and AgCN gets precipitated. Ultimately, a
second sudden change in potential may be visualized at this juncture when
practically most of the CN– ion gets precipitated as AgCN.
Choice of Electrodes :
Indicator Electrode : Silver electrode ;
Reference Electrodes : Colomel electrode ;
Mercury-mercury (I) sulphate electrode.
Salt-Bridge : A saturated solution of KNO3
or K2SO4 isolated from the reference electrode.
1.5. Potentiometric Titration in Non-Aqueous Solvents
The potentiometric technique has proved to be of great
significance and utility for determining end-points of titrations in a
non-aqueous media. The mV scale rather than the pH scale of the potentiometer
must be used for obvious reasons, namely :
(i) pH scale
based upon buffers has no logical significance in a non-aqueous media, and
(ii) the
potentials in non-aqueous media may exceed the pH scale.
The resulting titration curves are more or less emperical
and afford a reasonably dependable and reproducible means of end-point
detection.
Choice of Electrodes :
Indicator Electrodes : Glass electrode ;
Reference Electrode: Calomel electrode ;
Salt-Bridge: A saturated solution of KCl.
2. END-POINT DETERMINATION
In fact, there are several acceptable means to graph the
potentiometric titration data generated from an actual titration in order to
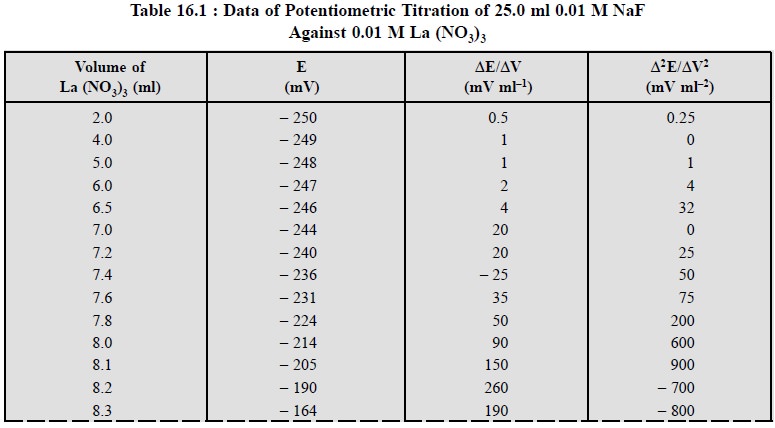
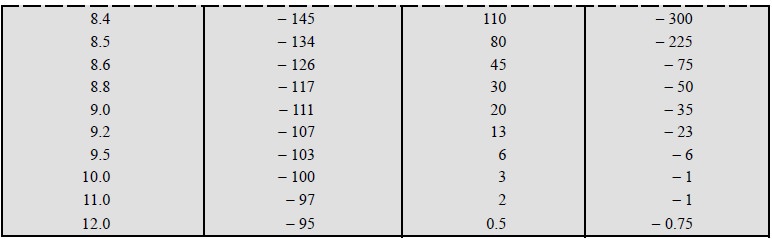
locate the exact (or nearest) end-point. These may be illustrated exclusively
by employing the titration data provided in Table 16.1, between 25 ml of 0.01 M
NaF and 0.01 M La (NO3)3.
The simplest and the most commonly used method is to plot
the cell voltage E, millivolts (mV), versus the volume (ml) of titrant added.
Ultimately, the end-point is determined from the point of maximum slope of the
curve i.e., the point of inflexion,
as depicted in Figure 16.1 (a).
However, the degree of accuracy and precision with which this point of
inflexion can be located from the plotted graph largely depends on the
individual number of data points observed in the close proximities of the
end-point.
Figure 16.1 (a)
gives rise to a sigmoid-curve (or S-shaped curve) obtained either by
using an appropriate equipment (automatic titrators) that plots the graph
automatically* as the titration proceeds, or manually by plotting the raw
experimental data. The central portion of the sigmoid curve, in fact is the
critical zone where the point of inflexion resides and this may be located by
adopting any one of the follow-ing three
procedures, namely :
(i)
Method of parallel tangents,
(ii)
Method of bisection, and
(iii)
Method of circle fitting
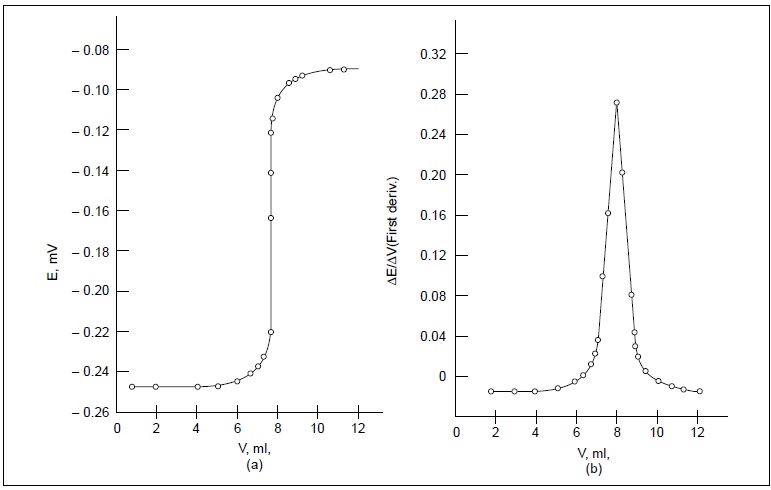
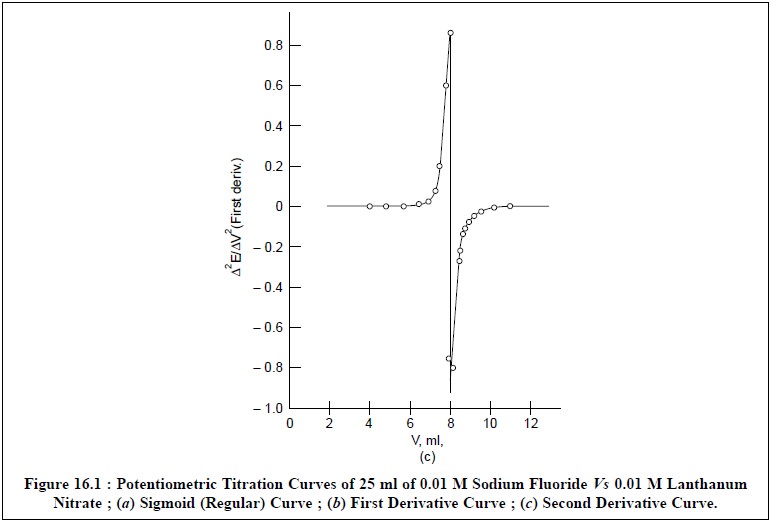
Figure 16.1 (b)
is obtained by plotting ∆E/∆V
against V which is termed as the first
derivative curve. It gives a
maximum at the point of inflexion of the titration curve i.e., at the end-point.
Figure 16.1 (c)
is achieved by plotting the slope of the frst derivative curve against the
volume of titrant added i.e., by
plotting ∆2E/∆V2
Vs V and is known as the second
derivative curve. Thus, the second derivative becomes zero at the point of
inflexion and hence, affords a more exact measurement of the equiva-lence
point.
The titration error (i.e.,
difference between end-point and equivalence point) is found to be small when
the potential change at the equivalence point is large. Invariably, in most of
the reactions employed in potentiometric analysis, the titration error is normally
quite small and hence may be neglected.
Related Topics