Term 3 Unit 2 | Geography | 7th Social Science - Map Reading | 7th Social Science : Geography : Term 3 Unit 2 : Map Reading
Chapter: 7th Social Science : Geography : Term 3 Unit 2 : Map Reading
Map Reading
Unit -2
Map Reading
Learning Objectives
• To know about the maps and scale
• To identify the various types of
maps
• To understand the elements of maps
• To learn the legend and signs and
symbols
Introduction
Reading of maps will give clear
understanding of geographical location, physiographic features like mountains,
plateaus and plains, water features – river, lake, ocean etc., and cultural
features, such as roads, settlement etc., The maps are meant to be the preserving
records of the past which will helps us to understand the past and perceive the
future. Maps portraits political boundaries
of different countries and states. It helps the students to visually understand
the size and shape of various countries, continents etc., Maps clearly refer to
the properties that people own and the geographical boundaries.
Maps
A map is an essential tool of a
geographer. Map is a representation of the earth as a whole or a part of the
earth drawn on a flat surface according to a given scale. It can show continents,
countries, cities and even a local area are drawn with specific details. It is
easy to handle and carry as it can be rolled up (or) folded and stored in
computers.
In the early times, various materials such as animal
skin,cloth,parchment,papyrus,wet earth and clay tablets wereused to make maps.
Types of Maps
As each map is unique in its design,
content and construction. On the basis of certain common features maps can be
classified into several types.
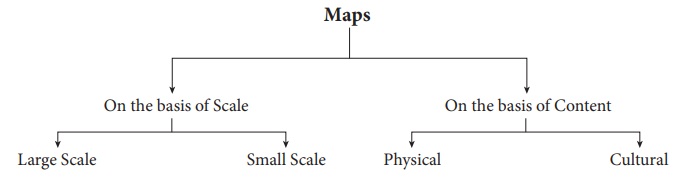
Maps on the basis of
scale:
Large scale maps show small areas in greater details
because they are drawn on a relatively large scale.
*
Cadastral maps are
village and town maps which show individual fields and house sites.
*
Topographical maps shows
smaller areas in much greater details about small area. These maps are
prepared by Survey of India. These are also large scale maps which show both
natural features like hills and valleys as well as man-made features like
buildings, road and canals.
Small scale maps that show large areas like continent
or countries. These maps are drawn on 1cm = 1000 kms. These are called
small-scale maps.
*
Wall maps are
small-scale maps showing large areas. They are useful for students in
classrooms and offices, small scale maps covers a larger area and depicts with
limited information.
* Atlas is a collection of maps in a book.
Atlas maps are small-scale maps covering large areas like continents and
countries. Only prominent relief features, main roads and railways important
towns are shown in Atlas maps. The study of geographic characteristics of a
large area is possible at the time with the help of an atlas.
The science of map-making is called cartography (cartemeans
‘map’ and graphic means ‘drawing’).One whodraws maps is called a Cartographer.
Types of Atlas
*
School Atlas contains
the maps giving sufficient details of the home and country
*
Advanced Atlas contains
detailed maps of even small regions of the continents and are used as
reference atlases.
*
Regional Atlas contains
detailed maps of small areas, prepared with a view to help in regional
planning.
*
National Atlas contains
detailed maps of a country. The maps of a national atlas are
comparatively large-sized and they depict general and characteristic features
of the geography of a country.
Maps on the basis of content
Physical maps show natural features such as relief,
geology, soils, drainage, elements weather, and vegetation.
* Relief maps
show general topography like mountains
valleys, plains, plateaus and rivers.
* Geological maps
are drawn to show geological structures, rocks and minerals.
* Climatic maps
show the distribution of temperature, rainfall, clouds, relative humidity,
direction and velocity of winds and other elements of weather.
* Soil maps
which are drawn to show the distribution of different types of soil and their
properties.
Cultural
maps
which shows the man-made features are called cultural maps.
* Political maps
show the administrative divisions of a country, state or district. These maps
facilitate the administration in planning and management of the concerned
administrative units.
* Population maps
show the distribution, density and growth of population, occupation structure
and literacy.
*
Economic maps depict the production
and distribution of different types of crops and minerals, location of
industries, trade routes and flow of commodities.
* Transportation maps
show roads, railway lines and the location of railway station, airports and
seaports, etc.,
* Thematic maps
represent the distribution of a particular feature or theme and its spatial
variation.
Digital maps is a web-based service that provides detailed information about
geographical regions and sites around theworld.
Elements of maps
Maps provide us with a lot of
information and one must know how to read and interpret them. Every map is
provided with certain features that help us to study the information presented
in it. The basic essential elements of a map are title, direction, scale and
legend (or) key and signs and symbols.
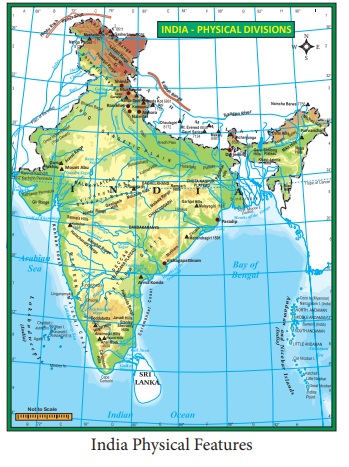
Title
Every map has a title that describes
the information given in the map. For example, a map with the title India
Rivers shows Rivers of India.
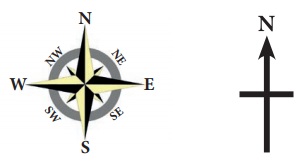
Direction
In general maps are drawn with North
orientation. It helps us to find other direction on the map like East, West and
South. In addition to the North notation, latitudes and longitudes are depicted
in the margins. The North is notified by letter ‘N’ with an arrow mark.
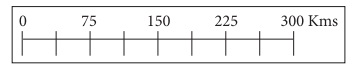
Scale
The scale of a map is the ratio
between the distance on the map between two points and actual distance between
the two places on the ground. For example the scales can be represented as 1cm
= 10km. It means 1cm on the map is equal to 10 km on the ground. It helps to
find the distance on the map between two points.
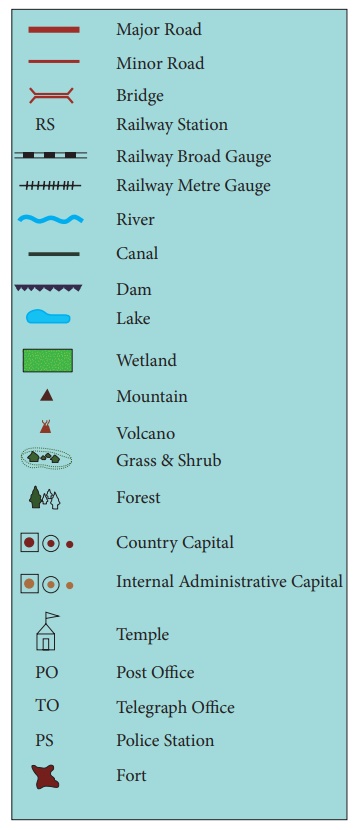
Legend (or) key
A legend or key of a map explains
the symbols that are used on it to represent various physical and cultural
features. The common signs and symbols which are internationally accepted and
used in maps are called conventional signs and symbols. Every map has a legend
or a key which explains the different colours and symbols used in it. On a map
it is difficult to show the real shape such as settlements, bridges, post
offices, railway lines and forests They are depicted by using certain colours,
symbols or letters.
Conventional signs and
symbols
A sign is a widely used symbol or a
line pattern or a colour on a map. It represents a feature on the ground. The
Survey of India (SOI) have standardized a set of convectional signs and
symbols. Several colours are commonly used in the map.
Uses of Maps
1.
Maps enable us to know details of the landforms.
2.
Maps help the military personnel to campaigns.
3.
It is used in the aero planes and ships.
4. Maps are used for weather forecasting.
Comparison of Map and Globe
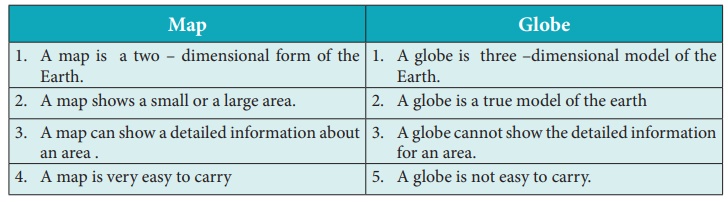
Map
1.
A map is a two – dimensional form of the Earth.
2.
A map shows a small or a large area.
3.
A map can show a detailed information about an area.
4.
A map is very easy to carry
Globe
1.
A globe is three –dimensional model of the Earth.
2.
A globe is a true model of the earth
3.
A globe cannot show the detailed information for an area.
4.
A globe is not easy to carry.
Wrap up
*
Map is a representation of the Earth as a whole (or) a part of the earth drawn
on a flat surface according to given scale.
*
Maps classified into two types on the basis of scale and on the basis of
content.
*
The basis essential elements of a map are title, direction, scale and legend
(or) key or symbol.
*
The cardinal direction are North, South, East and West.
*
The scale of a map is the ratio between the distance on the map between two
points.
*
A legend (or) key of a map explain the details in the ma
*
The Survey of India (SOI) have standardized a set of conventional signs and
symbols.
Glossary
1.
Map Representation of Earth on a
flat surface நிலவரைபடம்
2.
Scale Ratio between the Actual
distance of two points on the earth and
the distance on a map அளவை
3.
Legend It is a representation of
different geographical features by using different colours and symbols குறி
விளக்கம்
4.
Relief maps map that shows the
physical appearance of hills, mountains, ridges, valleys, slopes நிலத்தோற்ற
வரைப
5.
Atlas Collection of several maps வரைபடம்
6.Cardinal direction North, south, east and
west are called cardinal direction முதன்மையான
திசைககள்
7.
Thematic map Represent the
distribution of a particular feature. ககருததுப்டம்
8.
Graduated Arranged in a series பகுததுக
குறியிட்
அளவு
References:
1.
Practical Geography R. L. Singh Practical Geography
2.
RP. Misra, A. Ramesh (2002) Fundamental of Cartography, published and printed
by Ashok kumar Mittal. New Delhi.
Related Topics