Chapter: Civil : Design of Reinforced Concrete Elements : Limit State Design Of Columns
Limit State Of Collapse: Compression

LIMIT STATE OF COLLAPSE: COMPRESSION
Assumptions
1. The
maximum compressive strain in concrete in axial compression is taken as 0.002.
2. The
maximum compressive strain at the highly compressed extreme fibre in concrete
subjected to axial compression and bending and when there is no tension on the
section shall be 0.0035 minus 0.75 times the strain at the least compressed
extreme fibre.
In
addition the following assumptions of flexure are also required
3. Plane
sections normal to the axis remain plane after bending.
4. The
maximum strain in concrete at the outermost compression fibre is taken as
0.0035 in bending.
5. The
relationship between the compressive stress distribution in concrete and the
strain in concrete may be assumed to be rectangle, trapezoid, parabola or any
other shape which results in prediction of strength in substantial agreement
with the results of test.
6. An
acceptable stress strain curve is given in IS:456-200. For design purposes, the
compressive strength of concrete in the structure shall be assumed to be 0.67
times the characteristic strength. The partial safety factor y of 1.5 shall be
applied in addition to this.
7. The
tensile strength of the concrete is ignored.
8. The
stresses in the reinforcement are derived from representative stress-strain
curve for the type of steel used. Typical curves are given in IS:456-2000. For
design purposes the partial safety factor equal to 1.15 shall be applied.
Minimum eccentricity
As per IS:456-2000, all columns
shall be designed for minimum eccentricity, equal to the unsupported length of
column/ 500 plus lateral dimensions/30, subject to a minimum of 20 mm. Where
bi-axial bending is considered, it is sufficient to ensure that eccentricity
exceeds the minimum about one axis at a time.
Short Axially Loaded Members in Compression
The
member shall be designed by considering the assumptions given in 39.1 and the
minimum eccentricity. When the minimum eccentricity as per 25.4 does not exceed
0.05 times the lateral dimension, the members may be designed by the following
equation:
Pu
= 0.4 fck Ac + 0.67 fy Asc
Pu
= axial load on the member,
fck = characteristic compressive strength of the
concrete, Ac = area of concrete,
fy = characteristic strength of the compression reinforcement,
and As = area of longitudinal reinforcement for columns.
Compression
Members with Helical Reinforcement
The strength of compression members with helical reinforcement
satisfying the requirement of IS: 456 shall be taken as 1.05 times the strength
of similar member with lateral ties.
The ratio of the volume of helical reinforcement to the volume
of the core shall not be less than
Vhs
/ Vc > 0.36 (Ag/Ac - 1) fck/fy
Ag
= gross area of the section,
Ac = area of the core of the helically reinforced
column measured to the outside diameter of the helix,
fck
= characteristic compressive strength of the concrete, and
fy
= characteristic strength of the helical
reinforcement but not exceeding 415 N/mm.
Members
Subjected to Combined Axial Load and Uni-axial Bending
Use of
Non-dimensional Interaction Diagrams as Design Aids
Design
Charts (for Uniaxial Eccentric Compression) in SP-16
The design Charts (non-dimensional interaction curves) given
in the Design Handbook, SP : 16 cover the following three cases of
symmetrically arranged reinforcement :
(a)Rectangular
sections with reinforcement distributed equally on two sides (Charts 27 - 38):
the 'two sides' refer to the sides parallel to the axis of bending; there are
no inner rows of bars, and each outer row has an area of 0.5As this
includes the simple 4-bar configuration.
(b) Rectangular
sections with reinforcement distributed equally on four sides (Charts 39 - 50):
two outer rows (with area 0.3As each) and four inner rows (with area
0.1As each) have been considered in the calculations ; however, the
use of these Charts can be extended, without significant error, to cases of not
less than two inner rows (with a
minimum
area 0.3A in each outer row).
s
(c) Circular
column sections (Charts 51 - 62): the Charts are applicable for circular
sections with at least six bars (of equal diameter) uniformly spaced
circumferentially.
Corresponding
to each of the above three cases, there are as many as 12 Charts available
covering the 3 grades of steel (Fe 250, Fe 415, Fe 500), with 4 values of d1/
D ratio for each grade (namely 0.05, .0.10, 0.15, 0.20). For intermediate
values of d1/ D, linear interpolation may be done. Each of the 12
Charts of SP-16 covers a family of non-dimensional design interaction curves
with p/fck values ranging from 0.0 to 0.26.
From this, percentage of steel
(p) can be found. Find the area of steel and provide the required number of
bars with proper arrangement of steel as shown in the chart.
Typical
interaction curve
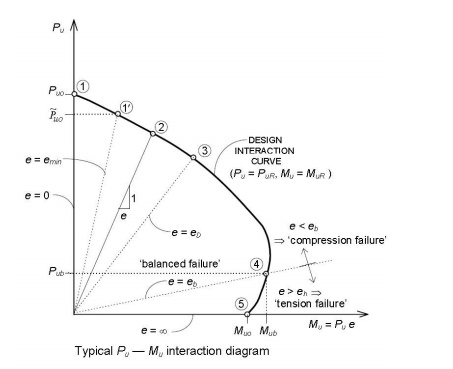
Salient Points on the Interaction Curve
The salient points, marked 1 to 5
on the interaction curve correspond to the failure strain profiles, marked 1 to
5 in the above figure.
� The point
1 in figure corresponds to the condition of axial loading with e = 0. For this
case of 'pure' axial compression.
� The point
11 in figure corresponds to the condition of axial loading with the
mandatory minimum eccentricity emin prescribed by the Code.
� The point
3 in figure corresponds to the condition xu = D, i.e., e = eD.
For e < eD, the
entire section is under compression and the neutral axis is
located outside the section (xu > D), with 0.002 < ?cu < 0.0035. For e > eD,
the NA is located within the section (xu < D) and ?cu = 0.0035 at the 'highly
compressed edge'.
� The point
4 in figure corresponds to the balanced failure condition, with e = eb
and xu = xu, b . The design strength values for this
'balanced failure' condition are denoted as
Pub
and Mub.
The point
5 in figure corresponds to a 'pure' bending condition (e = ?, PuR = 0); the resulting ultimate moment of
resistance is denoted Muo and the corresponding NA depth takes on a
minimum value xu, min.
Related Topics