Chapter: 11th 12th std standard Indian Economy Economic status Higher secondary school College
Law of Demand with Schedule and curve

Demand and Supply
Demand for a commodity refers to the desire backed by ability to pay and willingness to buy it. If a person below poverty line wants to buy a car, it is only a desire but not a demand as he cannot pay for the car. If a rich man wants to buy a car, it is demand as he will be able to pay for the car. Thus, desire backed by purchasing power is demand.
The demand for any commodity mainly depends on the price of that commodity. The other determinants include price of related commodities, the income of consumers, tastes and preferences of consumers, and the wealth of consumers. Hence the demand function can be written as
Dx = F (Px, Ps, Y, T, W)
where Dx represents demand for good x Px is price of good X
Ps is price of related goods Y is income
T refers to tastes and preferences of the consumers W refers to wealth of the consumer.
Law of Demand
The law of demand states that there is a negative or inverse relationship between the price and quantity demanded of a commodity over a period of time.
Definition: Alfred Marshall stated that ' the greater the amount sold, the smaller must be the price at which it is offered, in order that it may find purchasers; or in other words, the amount demanded increases with a fall in price and diminishes with rise in price'. According to Ferguson, the law of demand is that the quantity demanded varies inversely with price.
Thus the law of demand states that people will buy more at lower prices and buy less at higher prices, other things remaining the same. By other things remaining the same, we mean the following assumptions.
Assumptions of the Law
1. No change in the consumer's income
2. No change in consumer's tastes and preferences
3. No changes in the prices of other goods
4. No new substitutes for the goods have been discovered
5. People do not feel that the present fall in price is a prelude to a further decline in price.
Demand Schedule
Demand schedule is a tabular statement showing how much of a commodity is demanded at different prices.
Demand Schedule and Demand curve
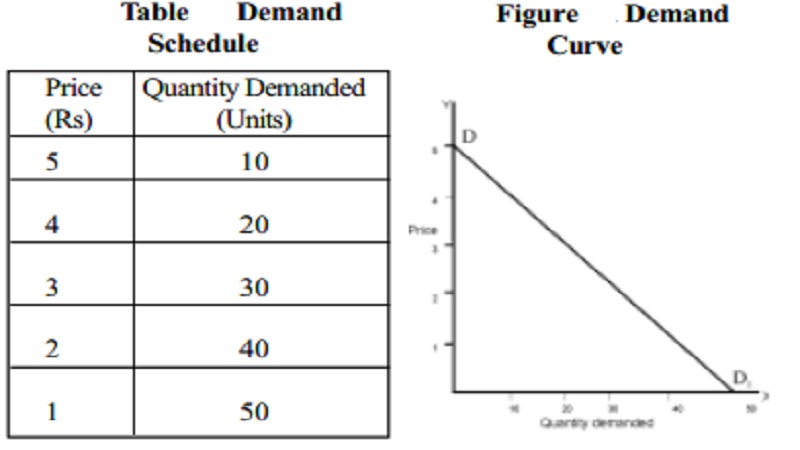
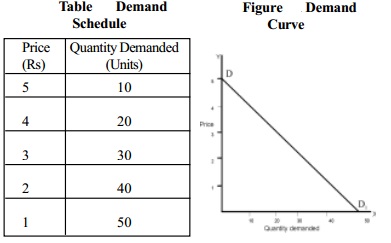
Table is a hypothetical demand schedule of an individual consumer. It shows a list of prices and corresponding quantities demanded by an individual consumer. This is an individual demand schedule.
Table : Demand Schedule
Price Quantity Demanded
(Rs) (Units)
5 10
4 20
3 30
2 40
1 50
Demand Curve

The demand schedule can be converted into a demand curve by measuring price on vertical axis and quantity on horizontal axis as shown in Figure.
In Figure, DD1 is the demand curve. The curve slopes downwards from left to right showing that, when price rises, less is demanded and vice versa. Thus the demand curve represents the inverse relationship between the price and quantity demanded, other things remaining constant.
Why does the demand curve slope downwards?
The demand curve slopes downwards mainly due to the law of diminishing marginal utility. The law of diminishing marginal utility states that an additional unit of a commodity gives a lesser satisfaction. Therefore, the consumer will buy more only at a lower price. The demand curve slopes downwards because the marginal utility curve also slopes downwards.
Individual demand and market demand schedules
Individual demand schedule tells the quantities demanded by an individual consumer at different prices.
Individual demand schedule for oranges
Price of oranges (Rs.) Quantity of oranges
5 1
4 2
3 3
2 4
1 5
It is clear from the schedule that when the price of orange is Rs.5/ - the consumer demands just one orange. When the price falls to Rs.4 he demands 2 oranges. When the price fals further to Rs 3, he demands 3 oranges. Thus, when the price of a commodity falls, the demand for that commodity increases and vice versa.
Market demand schedule
A demand schedule for a market can be constructed by adding up demand schedules of the individual consumers in the market. Suppose that the market for oranges consists of 2 consumers. The market demand is calculated as follows.
Table Demand Schedule for two consumers and the Market Demand Schedule
Price of Oranges Quantity demanded
(in Rs)
Consumer I Consumer II Market Demand
5 1 - 1
4 2 1 3
3 3 2 5
2 4 3 7
1 5 4 9
Market demand curve
The market demand also increases with a fall in price and vice versa.
In Figure, the quantity demanded by consumer I and consumer II are measured on the horizontal axis and the market price is measured on the vertical axis. The total demand of these two consumers i.e. D1 + D2 = DDM. - DDM - the market demand curve - also slopes downwards just like the individual demand curve. Like normal demand curvs, it is convex to the origin. This reveals the inverse relationship.
Related Topics