Term 2 Chapter 5 | 6th Maths - Information Processing | 6th Maths : Term 2 Unit 5 : Information Processing
Chapter: 6th Maths : Term 2 Unit 5 : Information Processing
Information Processing
CHAPTER 5
INFORMATION PROCESSING
Learning Objectives
* To know how to represent numerical and algebraic
expressions by tree diagrams.
* To know how to write numerical and algebraic expressions
from tree diagrams.
Introduction
In today's digital era, it is almost impossible
to imagine a day without computers. Right from small shops to big software companies,
the use of computers is inevitable. If there are no computers, most of the works
will be stopped. Computers are able to find solutions even for complicated numerical
expression and algebraic expression in quick and easy way. The answer given by the
computer will be very precise and need not to be recalculated. There will be a question,
how the computer read these expression?.
Yes, Computers use Tree diagram to perform
billions of operations in a uniform way and gives the answer. We will learn about
the Tree diagram for both numeric and algebraic expressions in this
chapter.
MATHEMATICS ALIVE – INFORMATION PROCESSING
IN REAL LIFE

Consider the numerical expression [(9 − 4 ) × 8
] ÷ [ ( 8 + 2 ) × 3]. We can try to understand the expression in a better way through
the tree diagram.
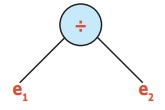
1) Let us consider e1
= (9 − 4) × 8, e2 = ( 8 + 2 ) × 3
we get
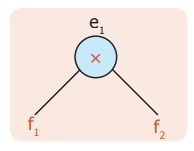
2) e1= f1 × f2 Where,
f1 = 9 − 4 and f2 = 8
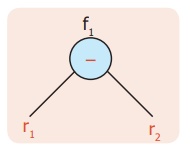
3) f1 = r1 − r2
where r1 = 9 and r2 = 4. f1 is represented as:
Similarly, the trees can be developed from e2.
4) Putting all together, we get the following tree
diagram
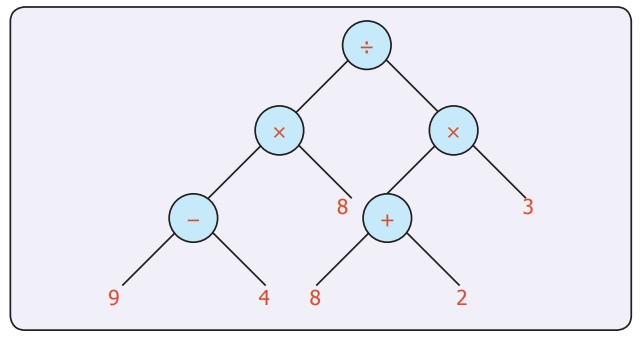
It is a picture which look like an upside-down tree!
Every node has one or two branches. And the leaves are numbers. The branching nodes have operations on them. It is called tree
diagram and the tree diagrams are general ways of representing arithmetical
expressions. Here trees are drawn upside down.
The root is at the top, the leaves are at the bottom.
Since all the arithmetical operations are binary (Involving two numbers) we have
only 2 way branching in the tree.
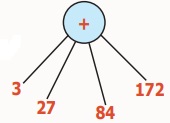
Can you represent the addition of
four numbers in the same way? Yes, there is a way for addition of 4 numbers.
Let us learn how to represent the statement problems
in tree diagram
Example 1:
In the flower exhibition conducted at Ooty for 4 days the number of
tickets sold on the first, second, third and
fourth days are 1,10,010; 75,070; 25,720 and 30,636 respectively. Find the total
number of tickets sold.
Solution:
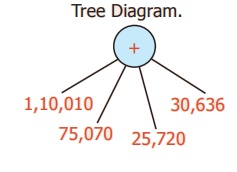
Number of tickets sold
on the first day = 1,10,010
Number of tickets sold
on the second day = 75,070
Number of tickets sold
on the third day = 25,720
Number of tickets sold
on the fourth day = 30,636
Total = 2,41,436
Total number of tickets sold = 2,41,436
Example 2:
In one year, a paper company had sold
6,25,610 notebooks out of a stock of 7,50,800
notebooks. Find the number of notebooks left unsold.
Solution:
Tree Diagram.
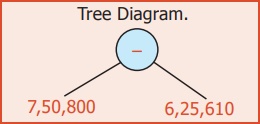
Number of Notebooks in
stock = 7,50,800
Number of Notebooks sold
= 6,25,610
Number of notebooks left unsold = 1,25,190
Example 3:
Vani and Kala along with three other
friends went to a butter milk shop.
The cost of one butter
milk is ₹ 6. If 9 more friends joined them, then how much money did they have to
pay? Vani said they had to pay ₹ 84 whereas Kala said
they had to pay ₹ 59. Who is correct ?
Solution:
Tree Diagram of (5 + 9) x 6
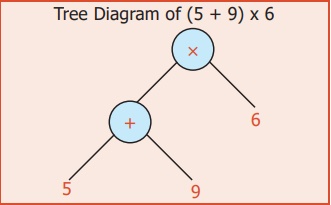
This confusion can be
resolved by using the brackets in the correct places like (5+9) × 6.
It is further clear from
the tree diagram.
Therefore Vani is correct
Example 4:
If a ration shop has distributed 1,00,000
kg of rice to 5000 families, then find the quantity of rice given to each
family?
Solution:
Tree Diagram.
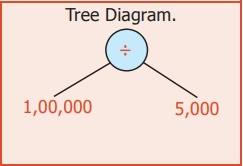
Quantity of rice to be
distributed to 5000 = 1,00,000 kg families
Quantity of rice distributed
to each family = 1,00,000 ÷ 5,000
= 20 kg
Each family was given 20 kg of rice.
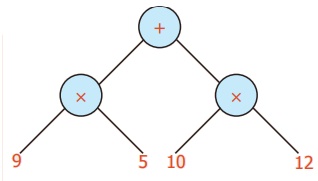
Example 5:
Convert into a Tree diagram (9 × 5) + (10 × 12)
Solution:
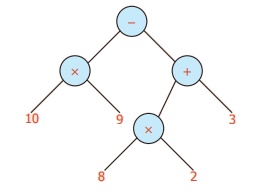
Example 6:
Convert into a Tree diagram (10 × 9) − (8 × 2) + 3
Solution:
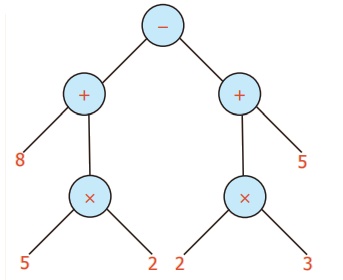
Example 7:
Convert into a Tree diagram [ 8+ (5 × 2)] – [(2 × 3) + 5]
Solution:
Example 8:
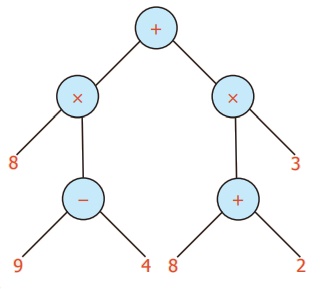
Convert into a Tree diagram [(9−4) × 8] + [(8+2) × 3]
Solution:
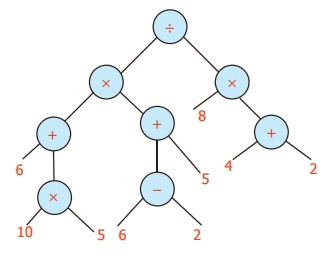
Example 9 :
Convert into a Tree diagram {[ (10 × 5) + 6] × [5 + (6 − 2)]} ÷ [8 × (4 + 2)] .
Solution:
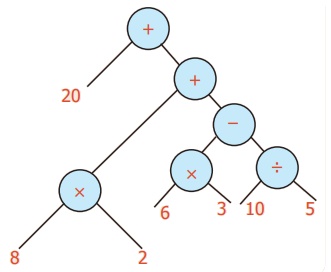
Example 10:
Convert into a Tree diagram 20+ [8 × 2+ {(6 × 3) – 10 ÷ 5} ].
Solution:
Related Topics