Chapter: Modern Analytical Chemistry: Kinetic Methods of Analysis
Flow Injection Analysis: Quantitative Applications
Quantitative Applications
In a quantitative flow injection analysis a calibration curve is determined
by injecting standard samples
containing known concentrations of analyte.
The format of the cali- bration curve, such as absorbance
versus concentration, is determined
by the method
of detection. Calibration curves for standard spectroscopic and electrochemical methods.
Flow injection analysis
has been applied
to a wide variety of samples, including environmental, clinical, agricultural, industrial, and pharmaceutical samples.
The majority of analyses to date involve environmental and clinical
samples, which is the focus of this section.
Quantitative analytical methods using FIA have been developed
for cationic, anionic, and molecular
pollutants in wastewater, fresh waters, groundwaters, and marine waters, several
examples of which
were described in the previous
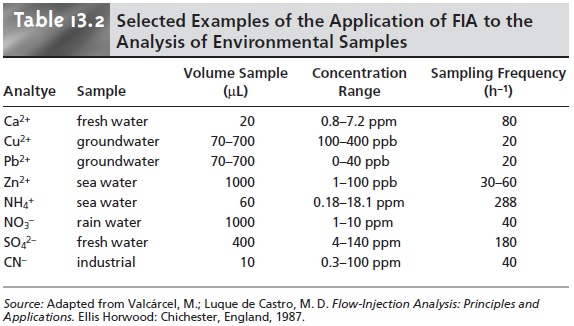
section. Table 13.2 provides a partial listing
of other analytes that have been
determined using FIA, many of which
are modifications of conventional standard
spectropho- tometric and potentiometric methods. An additional advantage of FIA for environ- mental analysis is its
ability to provide
for the continuous, in situ monitoring of pollutants in the field.

As noted, several
standard methods for the analysis
of water in- volve acid–base, complexation, or redox titrations. Flow injection analysis
also can be used for rapidly
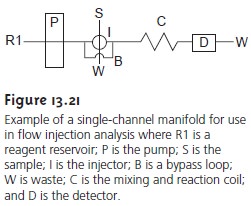
conducting such titrations using a single-channel manifold simi- lar to that shown
in Figure 13.21. A solution, consisting of a titrant (the
concen- tration of which
is stoichiometrically less than that of the analyte) and an indicator, is placed in the reservoir and continuously pumped
through the system.
When a sample is injected, it thoroughly mixes
with the titrant
in the carrier stream. The re-
action between the analyte, which
is in excess, and the titrant produces
a relatively broad flow
profile for the
sample. As the
sample moves toward
the detector, addi- tional mixing occurs. Due
to the continued reaction between titrant
and analyte, the analyte’s
concentration decreases, and the width of its flow profile
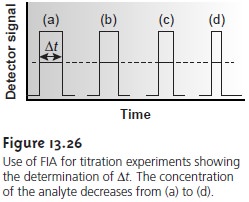
also de- creases. As the sample passes through the detector, the width of its flow profile, ∆t, is
determined by monitoring the indicator’s absorbance (Figure 13.26). Solutions with higher
initial concentrations of analyte have a greater
∆t. Calibration curves of ∆t versus log [analyte] are prepared
using standard solutions of analyte .


Flow injection analysis
has also found
numerous applications in the analysis
of clinical samples, using
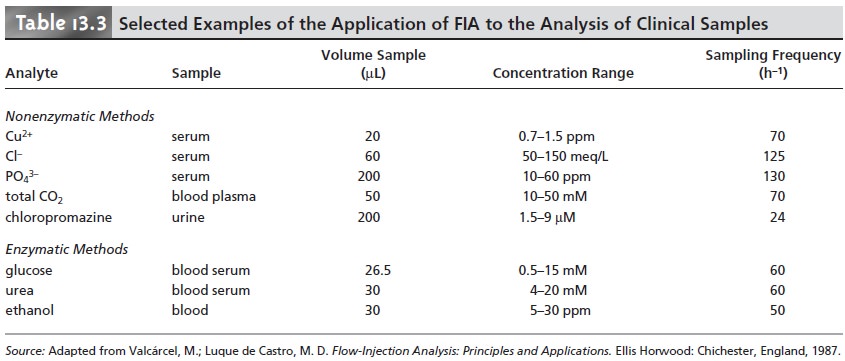
both enzymatic and nonenzymatic methods.
A list of selected examples is given in Table 13.3.

Representative Method
Although each FIA method has its own unique considera- tions, the determination of phosphate described in the following method provides an instructive example of a typical procedure.
Related Topics