Chapter: Power Quality : Voltage Sags and Interruptions
Estimating Voltage sag Performance
Estimating Voltage sag
Performance:
1. Introduction:
It is important to understand the expected voltage sag
performance of the supply system so that facilities can be designed and
equipment specifications developed to assure the optimum operation of
production facilities. The following is a general procedure for working with
industrial customers to assure compatibility between the supply system
characteristics and the facility operation:
ü Determine the number and characteristics of voltage sags that
result from transmission system faults.
ü Determine the number and characteristics of voltage sags that
result from distribution system faults (for facilities that are supplied from
distribution systems).
ü Determine the equipment sensitivity to voltage sags. This will
determine the actual performance of the production process based on voltage sag
performance calculated in steps 1 and 2.
ü Evaluate the economics of different solutions that could improve
the performance, either on the supply system or within the customer facility.
2. Area of
vulnerability
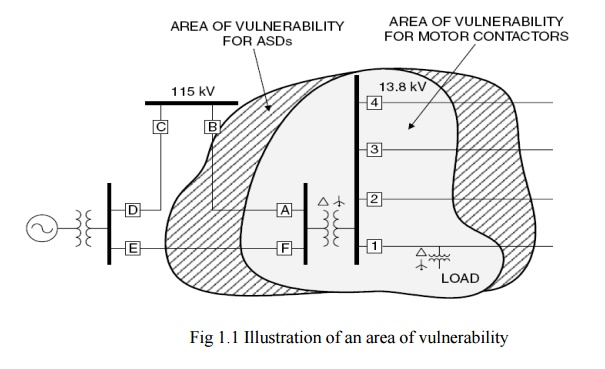
The concept of an area of
vulnerability has been developed to help evaluate the likelihood of
sensitive equipment being subjected to voltage lower than its minimum voltage sag ride-through capability.5 The latter term is defined as the minimum
voltage magnitude a piece of equipment
can withstand or tolerate without misoperation or failure. This is also known
as the equipment voltage sag immunity or susceptibility limit. An area of
vulnerability is determined by the total circuit miles of exposure to faults
that can cause voltage magnitudes at an end-user facility to drop below the
equipment minimum voltage sag ride-through capability. Figure 2.5 shows an
example of an area of vulnerability diagram for motor contactor and
adjustable-speed-drive loads at an end-user facility served from the
distribution system. The loads will be subject to faults on both the
transmission system and the distribution system.
3. Equipment
sensitivity to voltage sags
Equipment within an end-user facility may have different
sensitivity to voltage sags. Equipment sensitivity to voltage sags is very
dependent on the specific load type, control settings, and applications.
Consequently, it is often difficult to identify which characteristics of a
given voltage sag are most likely to cause equipment to misoperate. The most
commonly used characteristics are the duration and magnitude of the sag. Other
less commonly used characteristics include phase shift and unbalance, missing
voltage, three-phase voltage unbalance during the sag event, and the
point-in-the-wave at which the sag initiates and terminates. Generally,
equipment sensitivity to voltage
sags can be divided into three categories:
1.
Equipment sensitive to only the
magnitude of a voltage sag.
2.
Equipment sensitive to both the
magnitude and duration of a voltage sag.
3.
Equipment sensitive to
characteristics other than magnitude and duration.
3.1. Equipment sensitive to only the
magnitude of a voltage sag:
This group includes devices such as under voltage relays,
process controls,
motor drive controls, and many types of automated machines
(e.g., semiconductor manufacturing equipment). Devices in this group are
sensitive to the minimum (or maximum) voltage magnitude experienced during a
sag (or swell). The duration of the disturbance is usually of secondary importance
for these devices.
3.2. Equipment sensitive to both the
magnitude and duration of a voltage sag:
This group includes virtually all equipment that uses electronic
power supplies. Such equipment misoperates or fails when the power supply output
voltage drops below specified values. Thus, the important characteristic for
this type of equipment is the duration
that the rms voltage is below a specified threshold at which the
equipment trips.
3.3. Equipment sensitive to
characteristics other than magnitude and duration:
Some devices are affected by other sag characteristics such as
the phase unbalance during the sag event, the point-in-the wave at which the
sag is initiated, or any transient oscillations occurring during the
disturbance. These characteristics are more subtle than magnitude and duration,
and their impacts are much more difficult to generalize. As a result, the rms
variation performance indices defined here are focused on the more common
magnitude and duration characteristics.
For end users with sensitive processes, the voltage sag
ride-through capability is usually the most important characteristic to
consider. These loads can generally be impacted by very short duration events,
and virtually all voltage sag conditions last at least 4 or 5 cycles (unless
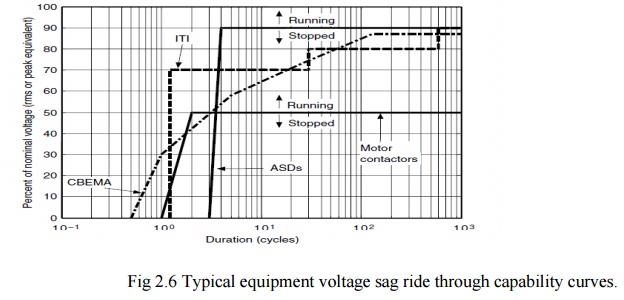
the fault is cleared by a current-limiting fuse). Thus, one of the most common
methods to quantify equipment susceptibility to voltage sags is using a
magnitude-duration plot as shown in Fig. 2.6. It shows the voltage sag magnitude
that will cause equipment to misoperate as a function of the sag duration.
The curve labeled CBEMA represents typical equipment sensitivity
characteristics. The curve was developed by the CBEMA and was adopted in IEEE
446 (Orange Book). Since the association reorganized in 1994 and was
subsequently renamed the Information Technology Industry Council (ITI), the
CBEMA curve was also updated and renamed the ITI curve. Typical loads will
likely trip off when the voltage is below the CBEMA, or ITI, curve.
The curve labeled ASD represents an example ASD voltage sag ride
through capability for a device that is very sensitive to voltage sags. It
trips for sags below 0.9 pu that last for only 4 cycles. The contactor curve
represents typical contactor sag ride-through characteristics. Ittrips for
voltage sags below 0.5 pu that last for more than 1 cycle.
The area of vulnerability for motor contactors shown in Fig. 2.5
indicates that faults within this area will cause the end-user voltage todrop
below 0.5 pu. Motor contactors having a minimum voltage sagride-through
capability of 0.5 pu would have tripped out when a fault causing a voltage sag
with duration of more than 1 cycle occurs within the area of vulnerability.
However,
faults outside this area will not cause the voltage to drop below 0.5 pu.
3.4 Transmission system sag
performance evaluation
The voltage sag performance for a given customer facility will
depend on whether the customer is supplied from the transmission system or from
the distribution system. For a customer supplied from the transmission system,
the voltage sag performance will depend on only the transmission system fault
performance. On the other hand, for a customer supplied from the distribution
system, the voltage sag performance will depend on the fault performance on
both the transmission and distribution systems.
Transmission line faults and the subsequent opening of the
protective devices rarely cause an interruption for any customer because of the
interconnected nature of most modern-day transmission networks. These faults
do, however, causes voltage sags. Depending on the equipment sensitivity, the
unit may trip off, resulting in substantial monetary losses.
ASPEN (Advanced System for Power Engineering) programs can
calculate the voltage throughout the system resulting from fault around the
system. It is also calculate the area of vulnerability in the specific
location.
3.5. Utility distribution system sag
performance evaluation
Customers that are supplied at distribution voltage levels are
impacted by faults on both the transmission system and the distribution system.
The analysis at the distribution level must also include momentary
interruptions caused by the operation of protective devices to clear the
faults.
Figure 2.2 shows a typical distribution system with multiple
feeders and fused branches, and protective devices. The utility protection
scheme plays an important role in the voltage sag and momentary interruption
performance. The critical information needed to compute voltage sag performance
can be summarized as follows:
Ø Number of feeders supplied from the substation.
Ø Average feeder length.
Ø Average feeder reactance.
Ø Short-circuit equivalent reactance at the substation.
They are two possible locations for faults on the distributed
system (i.e) On the same feeder and on parallel feeder.
Related Topics