Chapter: Modern Pharmacology with Clinical Applications: Pharmacokinetics
Drug Concentration-Time Profiles and Basic Pharmacokinetic Parameters
DRUG
CONCENTRATION–TIME PROFILES AND BASIC PHARMACOKINETIC PARAMETERS
The time course of a drug in
the body is frequently rep-resented as a concentration–time profile in which
the concentrations of a drug in the body are measured ana-lytically and the
results plotted in semilogarithmic form against time. A representative profile
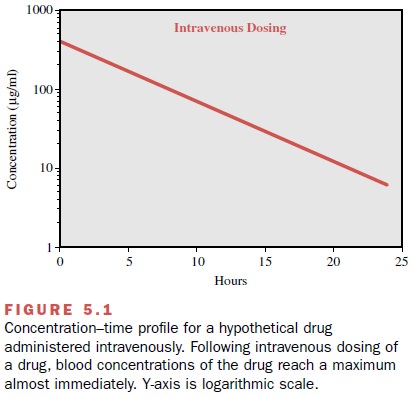
of a drug given in-travenously is presented in Figure 5.1. Drug concentra-tions
are measured in samples typically taken from the brachial vein, since this vein
is readily accessible, since sampling results in minimal patient discomfort and
since obtained values reflect the concentrations of drug in the bloodstream.
Concentrations in the blood may not be identical to concentrations at the site
of action, such as a receptor, but one hopes they serve as a surro-gate that
correlates in a proportional manner.

Figure 5.1 shows that for a
drug given intravenously, maximum concentrations are achieved almost
instanta-neously, since absorption across membranes is not re-quired, though
distributive processes may also occur (not depicted for the sake of simplicity).
The concentra-tions of drug in the blood decline over time according to the
elimination rate of that particular drug. More com-monly, drug is given via
extravascular routes (e.g., orally), so absorption and distribution must occur,
and therefore it will take some time before maximum con-centrations are
achieved.
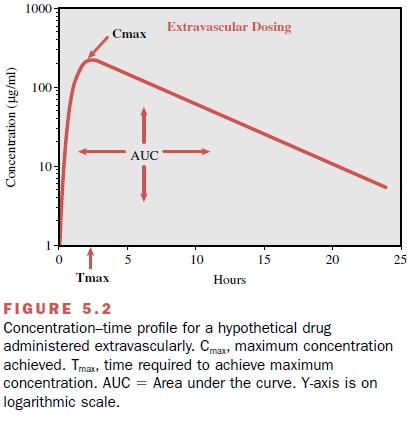
The blood concentration–time profile for a theoret-ical drug given extravascularly (e.g., orally) is shown in Figure 5.2. Some pharmacokinetic parameters, such as Cmax , Tmax , area under the curve, and half-life, can be es-timated by visual inspection or computation from a concentration–time profile.

Cmax is defined as the maximum concentration achieved in the blood. In Figure 5.2, Cmax can be estimated to be approximately 225 μg/mL. The other pharmacokinetic parameter that can be easily es-timated from a concentration–time profile is Tmax, or the time needed to reach maximum concentration. In Figure 5.2, the Tmax is estimated by visual inspection to be approximately 2 hours. The same drug in a formula-tion that permits a faster rate of absorption would have a shorter Tmax and generally a higher Cmax than the for-mulation with slower absorptive properties. Likewise, all other things being equal, a drug with a slower elimination rate will generally exhibit a longer Tmax and higher Cmax.
Once administered,
a drug begins undergo-ing absorption, distribution, metabolism, and excretion
all at once, not in a sequential fashion, such that all of these processes are
involved in determining the shape of a concentration–time profile.
One indicator of the overall
exposure of a person to a drug is through the calculation of the area under the curve (AUC). As the name
implies, AUC is the mathe-matically integrated area under the
concentration–time curve and is most commonly calculated using the trape-zoidal
rule of mathematics. In Figure 5.2, the AUC is represented by the shaded area.
Though the shape of the concentration–time profile may affect the AUC for a
drug, two drugs with entirely different concentra-tion–time profile shapes may
have the same AUC. It is, in fact, this property that makes calculating the AUC
useful, because it can be used to assess the person’s overall exposure to a
drug, even though the individual may have reached different Tmax and
Cmax values from those of other individuals. Furthermore, as will be
dis-cussed shortly, AUC is also useful for calculating an-other pharmacokinetic
parameter, clearance.
An additional parameter that
can be determined from a concentration–time profile is the half-life of the
drug, that is, the time it takes for half of the drug to be eliminated from the
body. Half-life determination is very useful, since it can readily be used to
evaluate how long a drug is expected to remain in the body after ter-mination
of dosing, the time required for a drug to reach steady state (when the rate of
drug entering the body is equal to the rate of drug leaving the body), and
often the frequency of dosing. The following equation is used to calculate the
half-life of a drug:
t1/2 = 0.693/ ke
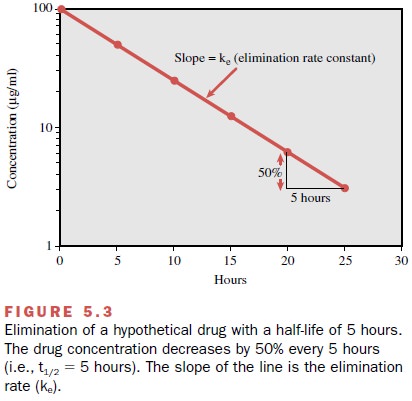
where t1/2 is the
half-life and ke is the elimination rate constant calculated from
the slope of the declining por-tion of the concentration–time profile (Fig.
5.3). By def-inition, half-life denotes that 50% of the drug in the body at a
given time will be eliminated over the calcu-lated period. However, this does
not mean that the same amount of drug
is eliminated each half-life. For ex-ample, Figure 5.3 shows that during the
first half-life pe-riod (0–5 hours) the drug concentration is reduced from 100 μg/mL
to 50 μg/mL. However, during the second half-life period (5–10 hours), even
though the amount in the body is reduced by 50%, the concentration falls only
from 50 μg/mL to 25 μg/mL (a reduction in con-centration of 25 μg/mL). This
concept is also illustrated in Table 5.1. It takes approximately five
half-lives for 97% of the drug to be eliminated from the body (re-gardless of
the duration of the half-life).


Thus, if one wished to switch a patient from one drug to another but not have both drugs present in substantial quantities, the clinician must wait five
half-lives (in this case, 25 hours) before administering the second drug. It
will also require five half-lives for a drug to reach steady state, again,
independent of the duration of the half-life. Steady state is when the amount
of drug entering the body is equal to the amount of drug being eliminated in a
given period. Finally, it is a rule of thumb (though certainly not ab-solute)
that drugs are generally dosed every half-life (with allowance for rounding to
convenient intervals). Thus, the concept of half-life has considerable
impor-tance for determining dosing frequency or adjusting doses in a patient.
Related Topics