Chapter: 11th 12th std standard Indian Economy Economic status Higher secondary school College
Characteristics of an isoquant
Production function through
Iso-quants
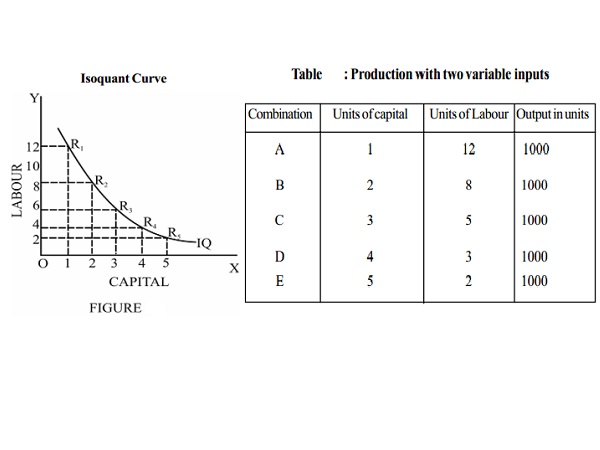
The isoquant analysis helps to understand how different
combinations of two or more factors are used to produce a given level of
output. Considering two factors of production, (capital and labour) the
following table shows various combinations of capital and labour that help
a firm to produce 1000 units of a product.
Production
with two variable inputs
Combination Units of capital Units of Labour Output in
units
A 1 12 1000
B 2 8 1000
C 3 5 1000
D 4 3 1000
E 5 2 1000
From the above table, it is clear that all combinations with
different quantities of labour and capital result in the same level of
production of 1000 units.
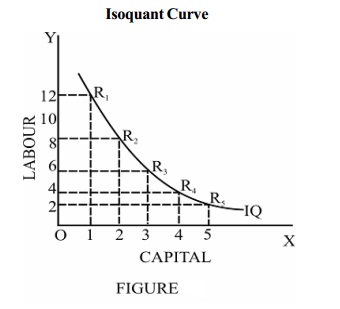
The two axes measure the quantities
of labour and capital and the curve IQ shows the different combinations that
produce 1000 units of output. Each of the points R1, R2,
R3, R4 and R5 on the curve shows a
capital-labour combination that can produce 1000 units of output. Therefore the
curve is known as an equal product curve or an iso-quant curve.
Thus an isoquant or isoproduct curve
represents different combinations of two factors of production that yield the
same level of output.
Characteristics
of an isoquant
1.
The isoquant is downward sloping
from left to right i.e. it is negatively sloped.
2.
An isoquant is convex to the origin
because of the diminishing marginal rate of technical substitution. Marginal
rate of technical substitution of factor X (capital) for factor Y (labour) may
be defined as the amount of factor Y (labour) which can be replaced by one unit
of factor X (capital), the level of output remaining unchanged.
MRTS C L = ∆L/ ∆C
MRTS can be calculated using the above formula
Combination Units of
capital Units of Labour MRTS CL
A 1 12
B 2 8 4
C 3 5 3
D 4 3 2
E 5 2 1
Thus the marginal rate of technical substitution is always
declining. Hence the isoquant is always convex to the origin. The slope of the
isoquant represents marginal rate of technical substitution.
3.
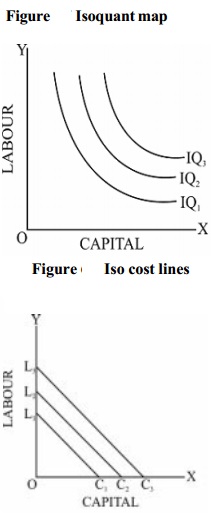
Higher the isoquant, higher will be
the level of output produced. A set of isoquants which represents different
levels of output is called 'isoquant map'.
In the isoquant map, the isoquants on the right side represent higher levels of
output and vice versa.
Isocost Line
The isocost line plays an important role in determining the
combination of factors that the firm will choose for production. An isocost
line is defined as locus of points representing various combinations of two
factors, which the firm can buy with a given outlay. Higher isocost lines
represent higher outlays (total cost) and lower isocost lines represent lower
outlays.
The
isocost line depends on two things :
4.
Prices of the factors of production
and
5.
the total outlay, which a firm has
to make on the factors of production. Given these two, the isocost line can be
drawn. The slope of the isocost line is equal to the ratio of the prices of two
factors. Thus the slope of the isocost line is given as
6.
Slope of isocost line = Price of factor X (Capital) / Price of factor
Y (Labour)
Related Topics