Chapter: Power Quality : Power Quality Monitoring
Application of Expert Systems for power quality monitoring
Application of Expert Systems for power quality monitoring
Many advanced power quality monitoring systems are equipped with either off-line or on-line intelligent systems to evaluate disturbances and system conditions so as to make conclusions about the cause of the problem or even predict problems before they occur. The applications of intelligent systems or autonomous expert systems in monitoring instruments help engineers determine the system condition rapidly. This is especially important when restoring service following major disturbances.
The implementation of intelligent systems within a monitoring instrument can significantly increase the value of a monitoring application since it can generate information rather than just collect data.11 The intelligent systems are packaged as individual autonomous expert system modules, where each module performs specific functions. Examples include an expert system module that analyzes capacitors witching transients and determines the relative location of the capacitor bank, and an expert system module to determine the relative location of the fault causing voltage sag.
1. Basic design of an expert system for monitoring applications
The development of an autonomous expert system calls for many approaches such as signal processing and rule-based techniques along with the knowledge-discovery approach commonly known as data mining. Before the expert system module is designed, the functionalities or objectives of the module must be clearly defined. In other words, the designers or developers of the expert system module must have a clear understanding about what knowledge they are trying to discover from volumes of raw measurement data. This is very important since they will ultimately determine the overall design of the expert system module.
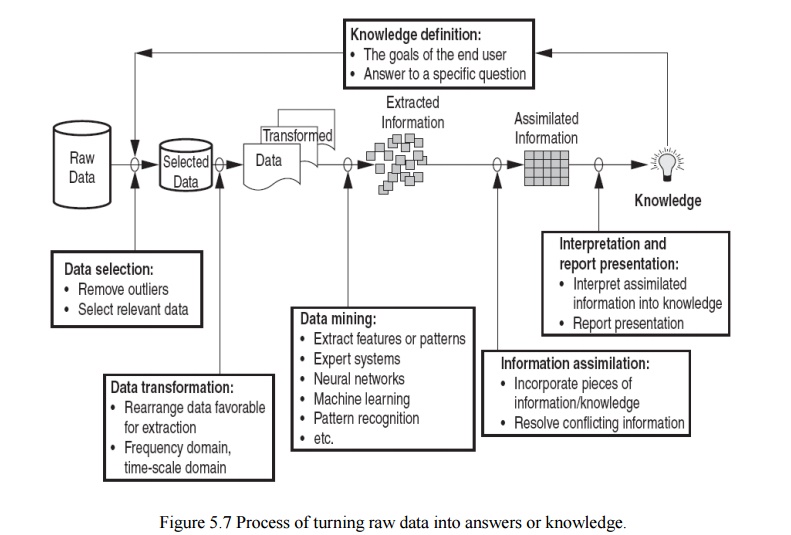
The process of turning raw measurement data into knowledge involves data selection and preparation, information extraction from selected data, information assimilation, and report presentation. These steps (illustrated in Fig. 5.7) are commonly known as knowledge discovery or data mining.
The first step in the knowledge discovery is to select appropriate measurement quantities and disregard other types of measurement that do not provide relevant information. In addition, during the data selection process preliminary analyses are usually carried out to ensure the quality of the measurement. For example, an expert system module is developed to retrieve a specific answer, and it requires measurements of instantaneous three-phase voltage and current waveforms to be available.
The data-selection task is responsible for ensuring that all required phase voltage and current waveform data are available before proceeding to the next step. In some instances, it might be necessary to interpolate or extrapolate data in this step. Other preliminary examinations include checking any outlier magnitudes, missing data sequences, corrupted data, etc. Examination on data quality is important as the accuracy of the knowledge discovered is determined by the quality of data.

The second step attempts to represent the data and project them onto domains in which a solution is more favorable to discover. Signal-processing techniques and power system analysis are applied. An example of this step is to transform data into another domain where the information might be located. The Fourier transform is performed to uncover frequency information for steady-state signals, the wavelet transform is performed to find the temporal and frequency information for transient signals, and other transforms may be performed as well.
Now that the data are already projected onto other spaces or domains,
we are ready to extract the desired information. Techniques to extract the information vary from sophisticated ones, such as pattern recognition, neural networks, and machine learning, to simple ones, such as finding the maximum value in the transformed signal or counting the number of points in which the magnitude of a voltage waveform is above a predetermined threshold value. One example is looking for harmonic frequencies of a distorted waveform. In the second step the waveform is transformed using the Fourier transform, resulting in a frequency domain signal.
A simple harmonic frequency extraction process might be accomplished by first computing the noise level in the frequency domain signal, and subsequently setting a threshold number to several fold that of the noise level. Any magnitude higher than the threshold number may indicate the presence of harmonic frequencies.
The data mining step usually results in scattered pieces of information. These pieces of information are assimilated to form knowledge. In some instances assimilation of information is not readily possible since some pieces of information conflict with each other. If the conflicting information cannot be resolved, the quality of the answer provided might have limited use. The last step in the chain is interpretation of knowledge and report presentation.
2. Example applications of expert systems
One or more autonomous expert system modules can be implemented within an advanced power quality monitoring system. When a power quality event is captured, all modules will be invoked. Each module will attempt to discover the unique knowledge it is designed to look for. Once the unique knowledge is discovered, the knowledge will be available for users to inspect. The knowledge can be viewed on a standard browser, or sent as an e-mail, pager, or fax message. We present a few examples of autonomous expert systems.
Voltage sag direction module, Voltage sags are some of the most important disturbances on
utility systems. They are usually caused by a remote fault somewhere on the power system;
however, they can also be caused by a fault inside end-user facilities. Determining the location of the fault causing the voltage sag can be an important step toward preventing voltage sags in the future and assigning responsibility for addressing the problem. For instance, understanding the fault location is necessary for implementing contracts that include voltage sag performance specifications. The supplier would not be responsible for sags that are caused by faults within the customer facility. This is also important when trying to assess performance of the distribution system in comparison to the transmission system as the cause of voltage sag events that can impact customer operations. The fault locations can help identify future problems or locations where maintenance or system changes are required. An expert system to identify the fault location (at least upstream or downstream from the monitoring location) can help in all these cases.
An autonomous expert system module called the voltage sag direction module is designed just for that purpose, i.e., to detect and identify a voltage sag event and subsequently determine the origin (upstream or downstream from the monitoring location) of the voltage sag event. If a data acquisition node is installed at a customer PCC, the source of the voltage sag will be either on the utility or the customer side of the meter. If the monitoring point is at a distribution substation transformer, the source of the voltage sag will be either the distribution system or the transmission system.
The voltage sag direction module works by comparing current and voltage rms magnitudes both before and after the sag event. It tracks phase angle changes from prefault to post fault. By assembling information from the rms magnitude comparison and the phase angle behavior, the origin of the voltage sag event can be accurately determined. In addition, the voltage sag direction module is equipped with algorithms to assess the quality of the knowledge or answer discovered. If the answer is deemed accurate, it will be sent as an output; otherwise, it will be neglected and no answer will be provided. In this way, inaccurate or false knowledge can be minimized. Inaccurate knowledge can be due to a number of factors, primarily to missing data and unresolved conflicting characteristics.
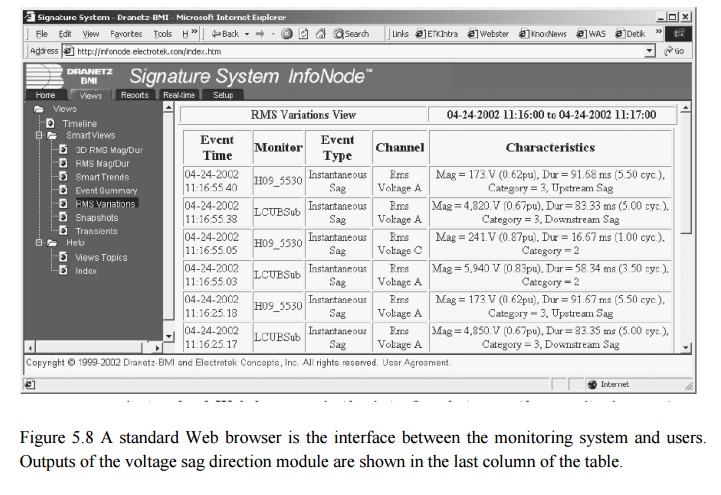
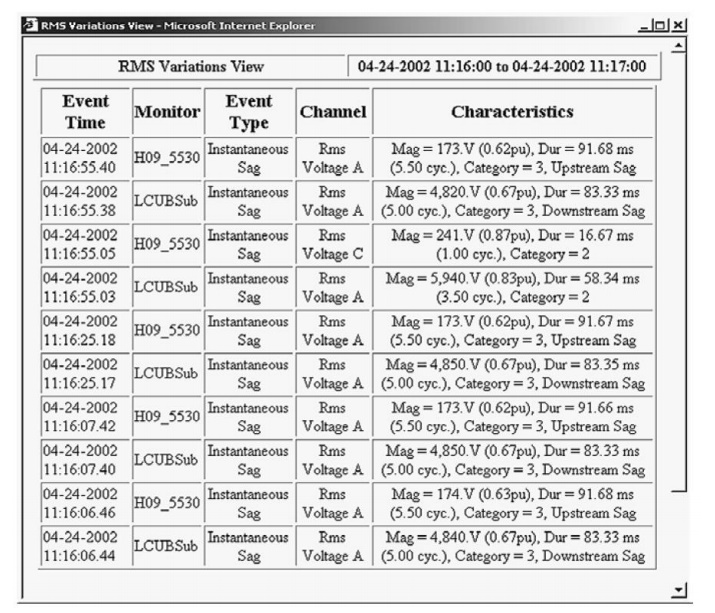
Outputs of the voltage sag direction module can be displayed on a computer screen using Web browser software, displayed in printed paper format, sent to a pager, or sent as an e-mail. Figure 5.8 shows an output of a voltage sag direction expert system module. The first column indicates the event time, the second column indicates the monitor identification, the third column indicates event types, the fourth column indicates the triggered channel, and finally the fifth column indicates the characteristics of the event and outputs of the answer module.

Figure 5.9 shows an event table with several voltage sag events that occurred at 11:16:55 A.M. on April 24, 2002. A tree branch that fell across a 13-kV overhead line caused the sag events. A total of five automatic re closure operations were performed before the breaker finally tripped and locked out. There were two data acquisition nodes available to capture this disturbance: one at the substation, i.e., at the secondary of 161/13-kV transformer (LCUBSub), where the affected overhead line was served, and one at the service entrance of a Electrotek office complex (H09_5530) located about 0.5 mi from the substation. Obviously, the LCUBSub and H09_5530 data acquisition nodes should report that the directions or the relative origin of voltage sags are downstream and upstream, respectively. Analysis provided by the voltage sag direction module reports the direction of the voltage sag correctly. Note that there are two voltage sag events where the module does not provide any knowledge about the origin of the sag event. This happens since the algorithms were unable to resolve conflicting characteristics extracted from the data.

Figure 5.9 An event summary report detailing time of occurrence and event characteristics. There are five voltage sag events associated with the autoreclosure operation following a fault. The voltage sag direction module identifies the origin of the sag correctly.
Radial fault locator module. Radial distribution feeders are susceptible to various short-circuit events such as symmetrical faults (three-phase) and unsymmetrical faults, including single-line-to-ground, double line-to-ground, and line-to-line faults. These system faults arise from various conditions ranging from natural causes such as severe weather conditions and animal contacts to human intervention and errors, including equipment failure. Quickly identifying the source and location of faults is the key to cost-efficient system restoration. The current practice to locate the faults is to send a lineperson to patrol the suspected feeders. While this is a proven method, it is certainly not a cost effective way to restore power.
An expert system module called the radial fault locator is developed to estimate the distance to a fault location from the location where the measurements were made. The unique feature of this module is that it only requires a set of three-phase voltages and currents from a single measurement location with the sequence impedance data of the primary distribution feeder. The module works by first identifying a permanent fault event based on the ground fault and phase fault pickup current threshold. Once a permanent fault event is identified, the distance to fault estimation is carried out based on the apparent impedance approach.13 Estimates of the distance to the fault are then displayed in a computer screen with the Web browser or sent to a lineperson via a pager. The lineperson can quickly pinpoint the fault location. This example illustrates the emerging trend in smart power quality monitoring, i.e., collect power quality data and extract and formulate information for users to perform necessary actions.
Capacitor-switching direction module. Capacitor-switching operations are the most common cause of transient events on the power system. When a capacitor bank is energized, it interacts with the system inductance, yielding oscillatory transients. The transient over voltage in an uncontrolled switching is between 1.0 to 2.0 pu with typical over voltages of 1.3 to 1.4 pu and frequencies of 250 to 1000 Hz. Transients due to energizing utility capacitor banks can propagate into customer facilities. Common problems associated with the switching transients include tripping off sensitive equipment such adjustable-speed drives and other electronically controlled loads. Some larger end-user facilities may also have capacitor banks to provide reactive power and voltage support as well. When a sensitive load trips off due to capacitor-switching transients, it is important to know where the capacitor bank is, whether it is on the utility side or in the customer facility. A capacitor-switching direction expert system module is designed to detect and identify a capacitor switching event and determine the relative location of the capacitor bank from the point where measurements were collected. It only requires a set of three-phase voltages and currents to perform the tasks mentioned. This module is useful to determine the responsible parties, i.e., the utility or customer, and help engineers pinpoint the problematic capacitor bank.
The capacitor-switching transient direction module works as follows. When an event is captured, the module will extract the information and represent it in domains where detection and identification are more favorable. The domains where the information is represented are in the time-, frequency-, and time-scale (wavelet) domains. If the root cause of the event is due to a capacitor bank energization, the answer module will proceed to determine the most probable location of the capacitor bank.
There are only two possible locations with respect to the monitoring location, i.e., upstream or downstream. The expert system module works well with grounded, ungrounded, delta-configured, and wye- (or star-) configured capacitor banks. It also works well for back-to-back capacitor banks. The capacitor-switching transient direction module is equipped with algorithms to determine the quality of the information it discovers. Thus, the module may provide an undetermined answer. This answer is certainly better than an incorrect one. An example application of the answer module to analyze data capture from a data acquisition node installed at an office complex service entrance is shown in Fig. 5.6. The analysis results are ,which is a screen capture from a standard Web browser. Since the office complex has no capacitor banks, any capacitor-switching transients must originate from the utility side located upstream from the data acquisition node. The module correctly determines the relative location of the capacitor bank. Note that there are some instances where the expert system was not able to determine the relative location of the capacitor bank. From the time stamp of the events, it is clear that capacitor bank energizations occur at about 5:00 A.M. and 7:00 P.M. each day.
Capacitor-switching operation inspection module. As described, capacitor switching transients are the most common cause of transient events on the power system and are results of capacitor bank energization operation. One common thing that can go wrong with a capacitor bank is for a fuse to blow. Some capacitor banks may not be operating properly for months before utility personnel notice the problem. Routine maintenance is usually performed by driving along the line and visually inspecting the capacitor bank.
An autonomous expert system was developed for substation applications to analyze downstream transient data and determine if a capacitor- switching operation is performed successfully and display a warning message if the operation was not successful.14 With the large number of capacitor banks on most power systems, this expert system module can be a significant benefit to power systems engineers in identifying problems and correlating them with capacitor-switching events.
Successful capacitor bank energization is characterized by a uniform increase of kvar on each phase whose total corresponds to the capacitor kvar size. For example, when a 1200-kvar capacitor bank is energized, reactive power of approximately 400 kvar should appear on each phase. The total kvar increase can be determined by computing kvar changes in individual phases from the current and voltage waveforms before and after the switching operation. This total computed kvar change is then compared to the actual or physical capacitor bank kvar supplied by a user. If the expected kvar was not realized, the capacitor bank or its switching device may be having some problems. The monitoring location is at the substation; thus, all capacitor banks along the feeders are downstream from the monitoring location. The first capacitor-switching event indicates that two phases of the capacitor are out of service. Either the fuses have blown or the switch is malfunctioning. The second event shows a successful capacitor-switching operation.
Lightning correlation module. The majority of voltage sags and outages in the United States are attributed to weather-related conditions such as thunderstorms. For example, TVA has approximately 17,000 mi of transmission lines where lightning accounts for as much as 45 percent of the faults on their system. The lightning correlation expert system module is designed to correlate lightning strikes with measured power quality events and make that information available in real time directly at the point of measurement. Armed with the correlation results, engineers can evaluate the cause and impact of voltage sags for a specific customer at a specific monitoring point as well as evaluate the impact on all customers for a given event.
When the lightning correlation module detects a voltage sag or transient event, it queries a lightning database via the Internet. The lightning data are provided by the U.S. National Lightning Detection Network operated by Global Atmospherics, Inc. If the query returns a result set, the lightning correlation module will store this information in the monitoring system database along with the disturbance data for information dissemination. The lightning data include the event time of the strike, the latitude and longitude of strike location, the current magnitude, and number of strokes.
3. Future applications
There are many applications for the intelligent power quality monitoring concept. Some of the more important applications are listed in this section.
■ Energy and demand profiling with identification of opportunities for energy savings and demand reduction
■ Harmonics evaluations to identify transformer loading concernsssss, sources of harmonics, problems indicating mis operation of equipment (such as converters), and resonance concerns associated with power factor correction
■ Voltage sag impacts evaluation to identify sensitive equipment and possible opportunities for process ride-through improvement
■ Power factor correction evaluation to identify proper operation of capacitor banks, switching concerns, resonance concerns, and optimizing performance to minimize electric bills
■ Motor starting evaluation to identify switching problems, inrush current concerns, and protection device operation
■ Short-circuit protection evaluation to evaluate proper operation of protective devices based on short-circuit current characteristics, time-current curves, etc.
Related Topics