Chapter: Mathematics (maths) : Queueing Theory
Queueing Theory
QUEUEING THEORY
Introduction
Markovian Queues
Birth & Death processes
Single and Multiple server queueing models
Little’s formula
Queues with finite waiting rooms
Queues with impatient customers
Queues with impatient customers
1 The input (or Arrival Pattern)
(a) Basic Queueing Process:
Since the customers arrive in a random fashion. Therefore their arrival pattern can be described in terms of Prob. We assume that they arrive according to a Poisson Process i.e., the no f units arriving until any specific time has a Poisson distribution. This is the case where arrivals to the queueing systems occur at random, but at a certain average rate.
(b) Queue (or) Waiting Line
(c) Queue Discipline
It refers to the manner in which the members in a queue are choosen for service
Example:
i. First Come First Served (FIFS) (or)
First In First Out (FIFO)
ii. Last Come, First Served (LCFS)
iii. Service In Random Order (SIRO)
iv. General Service Discipline (GD)
1.1 TRANSIENT STATE
A Queueing system is said to be in transient state when its operating characteristics are dependent on time. A queueing system is in transient system when the Prob. distribution of arrivals waiting time & servicing time of the customers are dependent.
1.2 STEADY STATE:
If the operating characteristics become independent of time, the queueing system is said to be in a steady state. Thus a queueing system acquires steady state, when the Prob. distribution of arrivals are independent of time. This state occurs in the long run of the system.
2 TYPES OF QUEUEING MODELS
There are several types of queueing models. Some of them are
1. Single Queue - Single Server Point
2. Multiple Queue - Multiple Server Point
3. Simple Queue - Multiple Server Point
4. Multiple Queue - Single Server Point
5. The most common case of queueing models is the single channel waiting line.
Note
P = Traffic intensity or utilization factor which represents the proportion of time the servers are busy = λ/4.
Characteristics of Model I
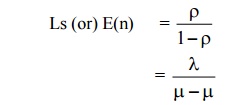
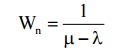
1)Expected no. of customers in the system is given by
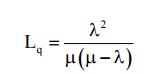
2)Expected (or avg) queue length (or) expected no. of customer waiting in the queue is given by
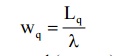
3) Expected (or avg.) waiting time of customer in the queue is given by
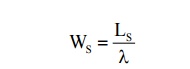
4) Expected (or avg.) waiting time of customer in the system (waiting & service) is given By
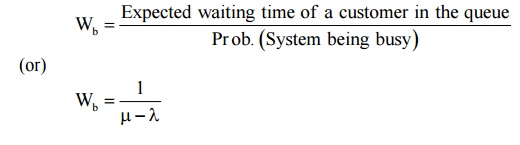
5) Expected (or avg.) waiting time in the queue for busy system
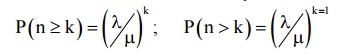
6) Prob. Of k or more customers in the system
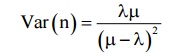
7) The variance (fluction) of queue length
8) Expected no. of customers served per busy
9) Prob. Of arrivals during the service time of any given customer
10) Prob. Density function of waiting time (excluding service) distribution
11) Prob. Density function of waiting + service time distribution
12) Prob. Of queue length being greater than on equal to n
13) Avg waiting time in non-empty queue (avg waiting time of an arrival Wh waits)
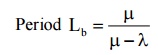
14) Avg length of non-empty queue
(Length of queue that is formed from time to time) = 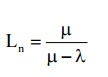
3 Littles' Formulae
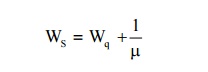
We observe that LS = λWS, Lq = λWq & WS = Wq + 1/µ and these are called Little's Formulae
3.1 Model I: (M/M/1)" (∞/FCFS)
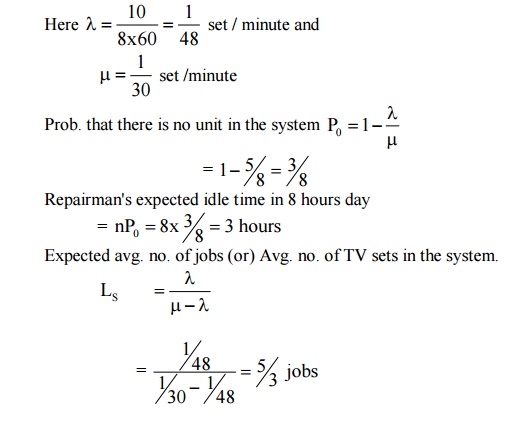
A TV repairman finds that the time spend on his job has an exponential distribution with mean 30 minutes. If the repair sets in the order in which they came in and if the arrival of sets is approximately Poisson with an avg. rate of 10 per 8 hours day, what is the repairman's expected idle time each day? How many jobs are ahead of avg. set just brought?
It is (M/M/1): (∞/FSFC) Problem
Example:4.31
In a railway marshalling yard, goods trains arrive at a rate of 30 trains per day. Assuming that the inter-arrival time follows an exponential distribution and the service time (tie time taken to hump to train) distribution is also exponential with an avg. of 36 minutes. Calculate
(i) Expected queue size (line length)
(ii) Prob. that the queue size exceeds 10.
If the input of trains increase to an avg. of 33 per day, what will be the change in
(i) & (ii)
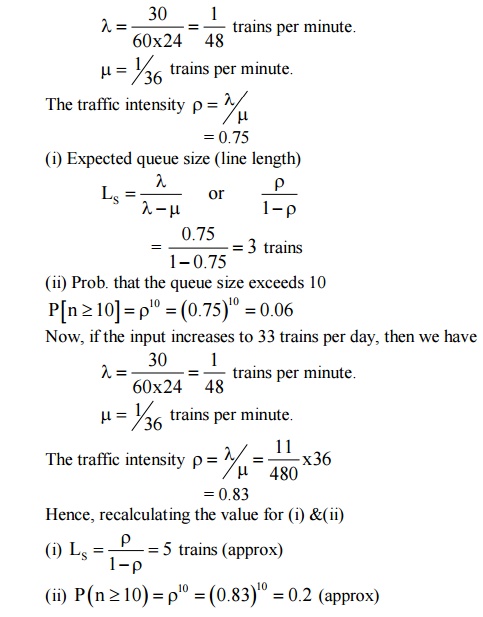
Hence recalculating the values for (i) & (ii)
(i) Ls = ρ/ 1-ρ= 5 trains (approx)
(ii) P(n ≥ 1010)=(0.83)10= 0.ρ2(approx)
Example:4.3.2
(3) A super market has a single cashier. During the peak hours, customers arrive at a rate of 20 customers per hour. The average no of customers that can be processed by the cashier is 24 per hour. Find
(i) The probability that the cashier is idle.
(ii) The average no of customers in the queue system
(iii)The average time a customer spends in the system.
(iv) The average time a customer spends in queue.
(v) The any time a customer spends in the queue waiting for service
λ= 20 customers
µ= 24 customers / hour
(i) Prob. That the customer is idle = 1- λ/µ= 0.167
(ii) Average no of customers in the system.
Ls = λ/ µ-λ= 5
(iii)Average time a customer spends in the system
Ws = Ls / λ= ¼ hour = 15 minutes.
(iv) Average no of customers waiting in the queue Lq = λ2 / µ(µ-λ) = 4.167
(v) Average time a customer spends in the queue
Wq = λ/ µ(µ-λ) = 12.5 minutes
4 Model (IV) : (M/M/I) : (N/FCFS)
Single server finite queue model
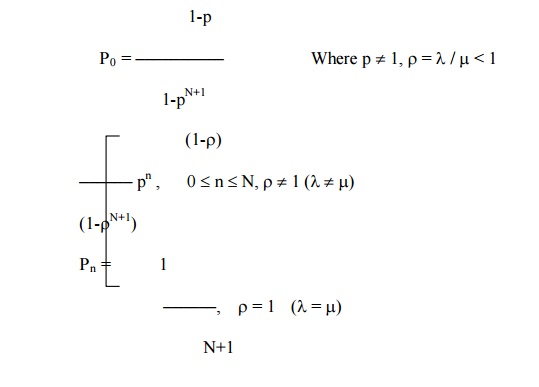
4.3 CHARACTERISTIC OF MODEL IV
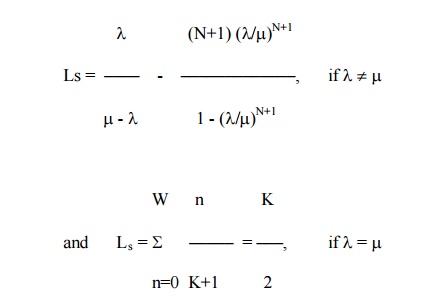
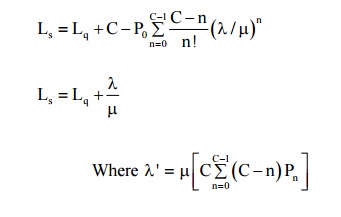
(1) Average no of customers in the system
(2) Average no of customers in the queue
Lq = Ls – (1- p0)
Lq = Ls – λ/ µ, where λ′= µ(1- p0)
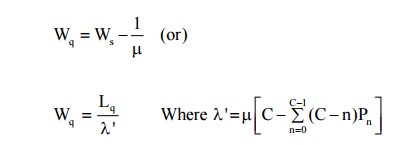
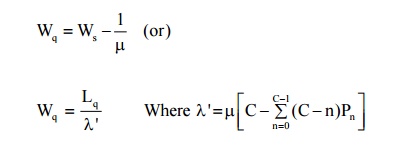
(3) Average waiting times in the system and in the queue
Ws = Ls / λ′& Wq = Lq / λ′, λ′= µ(1-ρ0)
(4) Consider a single server queuing system with Poisson input, exponential service times, suppose the mean arrival rate is 3 calling units per hour, the expected service time is 0.25 hours and the maximum permissible no calling units in the system is two. Find the steady state probability distribution of the no of calling units in the system and the expected no of calling units in the system.
λ= 3 units per hour
λ= 4 units per hour & N = 2
The traffic intensity ρ= λ/µ= 0.75
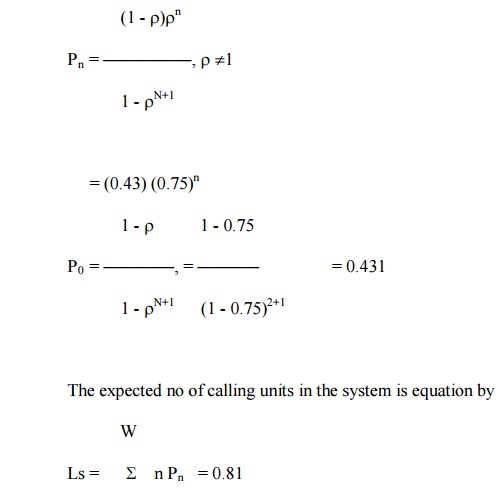
n = 1
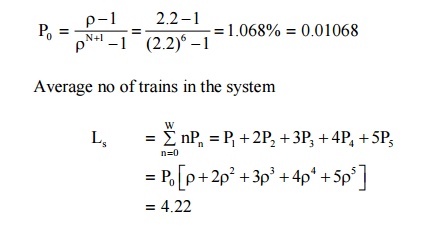
(2) Trains arrive at the yard every 15 minutes and the services time is 33 minutes. If the line capacity of the yard is limited to 5 trains, find the probability that yard is empty and the average no of trains in the system.
λ= 1/15 per minute; µ= 1/33 per minutes
ρ= λ/ µ= 2.2
Probability that the yard is empty
5 MULTIPLE – CHANNEL QUEUING MODELS
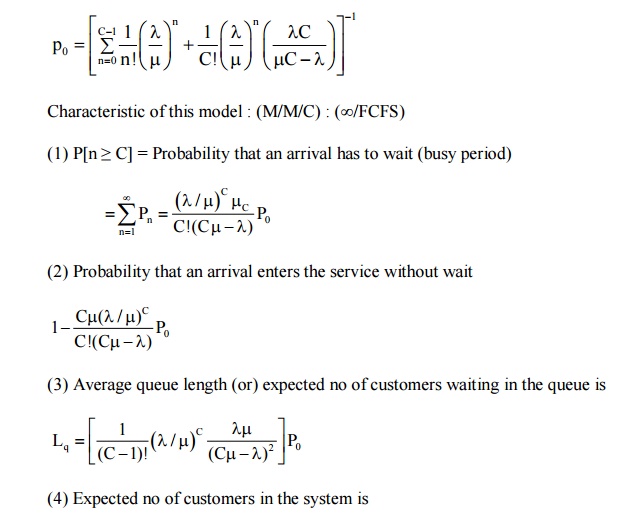
Model V (M / M / C) : ( ∞/ FCFS)
(Multiple Servers, Unlimited Queue Model)
(M/M/C) (∞/FCFS) Model
Example:4.5.1
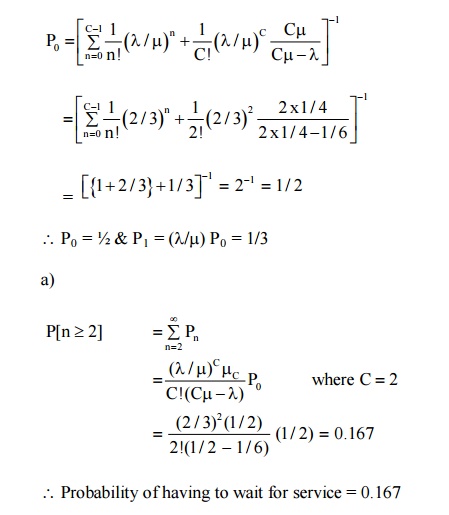
(1) A super market has 2 girls running up sales at the counters. If the service time for each customers is exponential with mean 4 minutes and if people arrive in Poisson fashion at the rate of 10 an hour.
(a) What is the probability of having to wait for service ?
(b) What is the expected percentage of idle time for each girl.
(c) (c) If the customer has to wait, what is the expected length of his waiting time.
C = 2, λ= 1/6 per minute µ= ¼ per minute λ/ Cµ= 1/3.
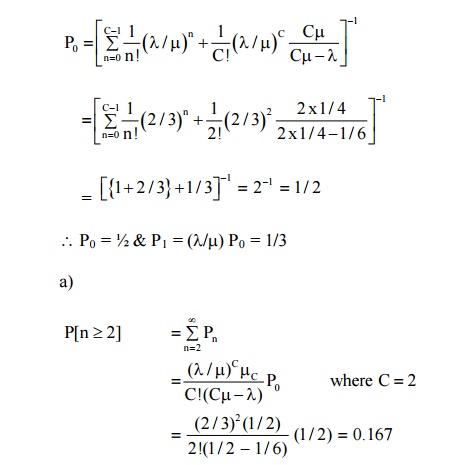
∴ Probability of having to wait for service = 0.167
b) Expand idle time for each girl = 1 - λ/Cµ
= 1 – 1/3 = 2/3 = 0.67 = 67%
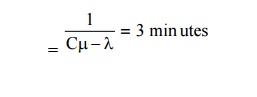
Expected length of customers waiting time
Example:4.5.2
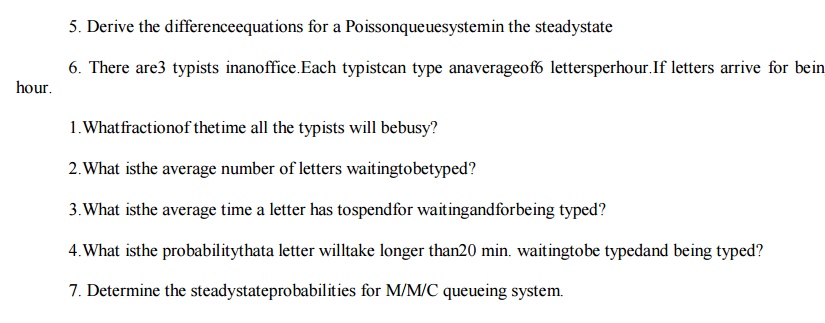
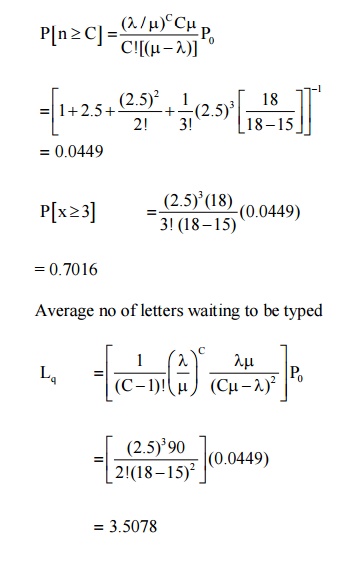
There are 3 typists in an office. Each typist can type an average of 6 letters per hour. If letters arrive for being typed at the rate of 15 letters per hour, what fraction of time all the typists will be busy ? what is the average no of letters waiting to be typed ?
Here C = 3; λ= 15 per hour; µ= 6 per hour
P[all the 3 typists busy] = p[n ≥ m]
Where n = no. of customer in the system
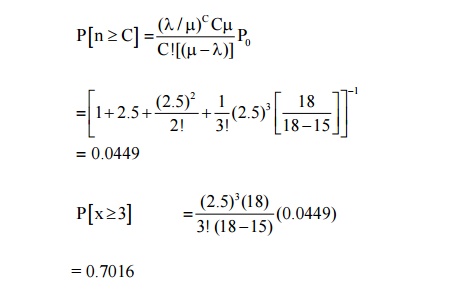
= 0.7016
Average no of letters waiting to be typed
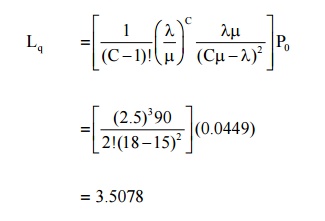
6 Model VI : (M/M/C) : (N / FCFS)
(Multiple Server, Limited Curved Model)
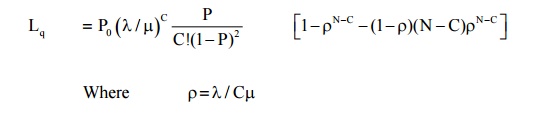
6.1 Characteristics of the model
(1) Expected or average no. of customers in the queue
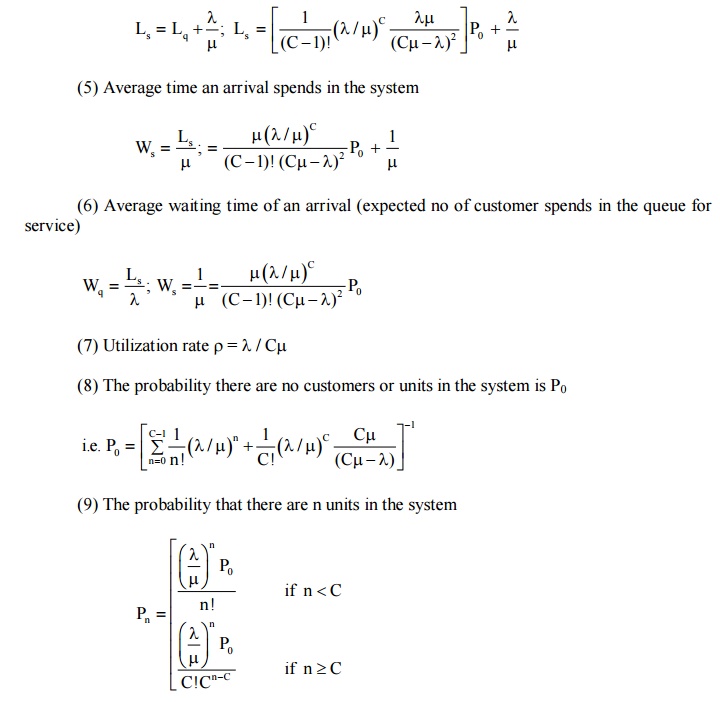
(2) Expected no of customers in the system
(3) Expected waiting time in the system
(4) Expected waiting time in the queue
Example:4.6.1 A car service station has two bags where service can be offered simultaneously. Due to space limitation, only four cars are accepted for servicing. The arrived pattern is poission with a mean of one car every minute during the peak hours. The service time is exponential with mean 6 minutes. Find the average no of cars in eh system during peak hours, the average waiting time of a car and the average no of cars per hour that cannot enter the station because of full capacity.
λ= 1 car per minutes
µ= 1/6 per minute
C = 3, N = 7, ρ= λ/ Cµ= 2
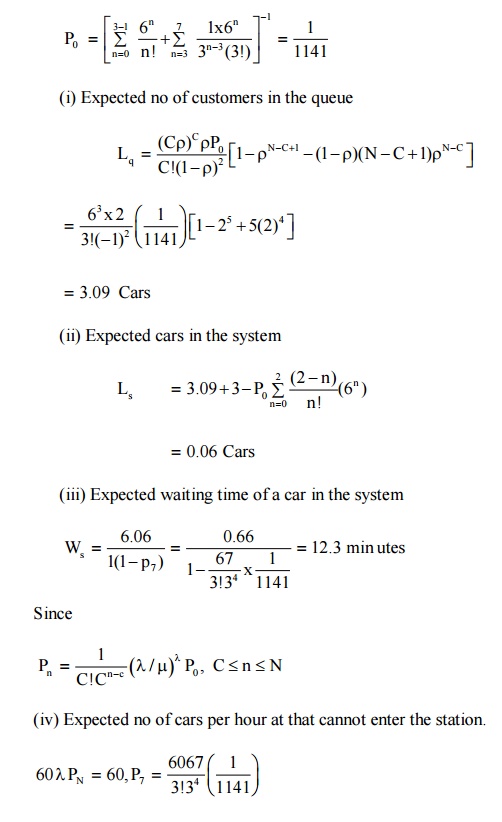
= 30.4 cars per hour
Example:4.6.2 A barber shop has two barbers and three chairs for customers. Assume that customers arrive in a poisson fashion at a rate of 5 per hour and that each barber services customers according to an exponential distribution with mean of 15 minutes. Further if a customer arrives and there are no empty chairs in the shop, he will leave. What is the probability that the shop is empty ? What is the expected no of customers in the shop ?
Here C = 2, N = 3,
λ= 5/60 = 1/12 customer / minute,
µ= 1/15 customers / minute
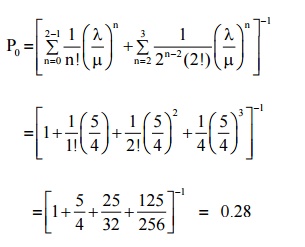
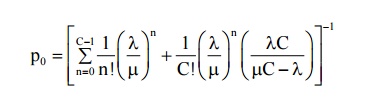
Probability that the shop is empty = probability that there are no customers in the system
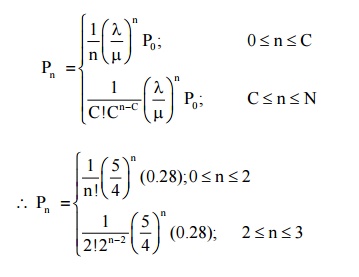
P0 = 0.28
Probability that there are n units in the system
The expected no of customers in the shop
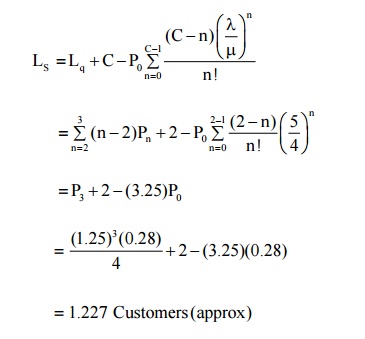
=1.227 Customers(approx)
7 Finite Source Models
Single-channel finite population model with Poisson arrivals and exponential service (M/M/I)(FCFS/n/M).
Characteristics of Finite Source Model (M/M/I) : FCFS/n/M
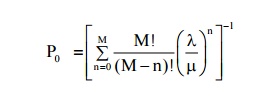
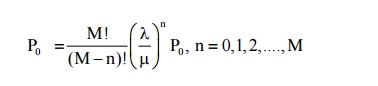
(1) Probability that the system is idle
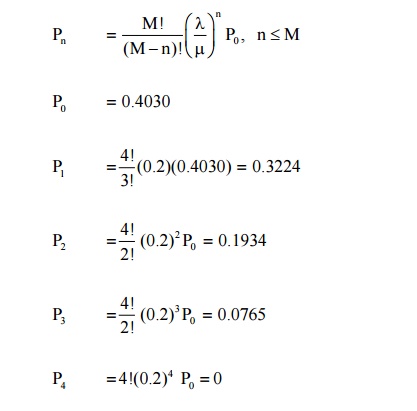
(2) Probability that there are n customers in the system
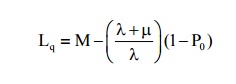
(3) Expected no of customers in the queue (or queue length)
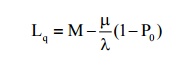
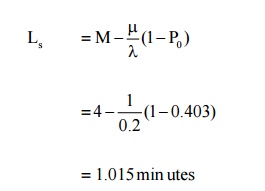
(4)Expected no of customers in the system
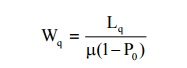
(5) Expected waiting time of a customer in the queue
(6) Expected waiting time of a customer in the system
Example:4.7.1. A mechanic repairs machines. The mean time b/w service requirements is 5 hours for each machine and forms an exponential distribution. The mean repair time is C hour and also follows the same distribution pattern.
(i) Probability that the service facility will be idle
(ii) Probability of various no of machines (0 through 4) to be and being repaired
(iii) Expected no of machines waiting to be repaired and being repaired
(iv)Expected time a machine will wait in queue to be repaired.
gn C = 1 (only one mechanic), λ= 1/5 = 0.2 Machine / hours
µ= 1 Machine / hour, µ= 4 Machines
ρ= λ/µ= 0.2
(i) Probability that the system shall be idle (or empty) is
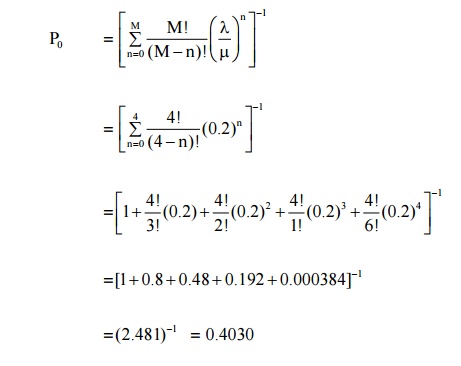
=[1 +0.8 0+.48 0.+192 0.000384]+−1
=(2.481)−1 =0.4030
(ii) Probability that there shall be various no of machines (0 through 5) in the system is obtained by using the formula
(iii) The expected no of machines to be and being repaired (in the system)
(iv) Expected time the machine will wait in the queue to be repaired
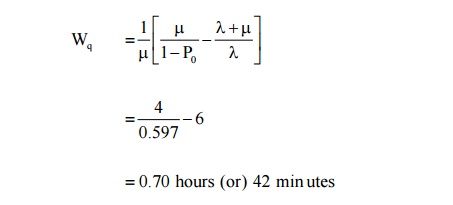
=0.70 hours (or) 42 min utes
Example:4.7.2. Automatic car wash facility operates with only one bay cars arrive according to a poisson is busy. If the service time follows normal distribution with mean 12 minutes and S.D 3 minutes, find the average no of cars waiting in the parking lot. Also find the mean waiting time of cars in the parking lot.
A = 1/15, E(T) = 12 min, V(T) = 9 min,
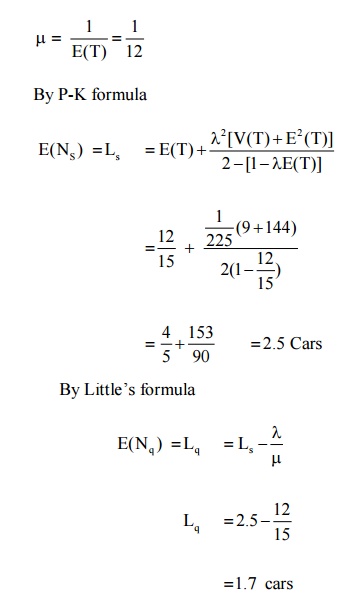
∴ The average no of cars waiting in the parking lot = 1.7 cars The mean waiting time of the cars in the parking lot
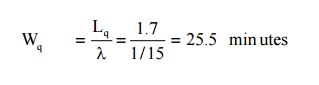
(or) 0.425 hour
WORKED OUT EXAMPLE
Example 1: A super market has 2 girls running up sales at the counters. If the service time for each custo minutes and if people arrive in Poisson fashion at the rate of 10 an hour.
(a) What is the probability of having to wait for service ?
(b) What is the expected percentage of idle time for each girl.
If the customer has to wait, what is the expected length of his waiting time.
C = 2, λ= 1/6 per minute µ= ¼ per minute λ/ Cµ= 1/3.
∴ Probability of having to wait for service = 0.167 b) Expand idle time for each girl = 1 - λ/Cµ
= 1 – 1/3 = 2/3 = 0.67 = 67%
Expected length of customers waiting time = 1/ µ −λ=3 minutes
Example 2: There are 3 typists in an office. Each typist can type an average of 6 letters per hour. If letters of 15 letters per hour, what fraction of time all the typists will be busy ? what is the average no of letters waiting to
Here C = 3; λ= 15 per hour; µ= 6 per hour
P[all the 3 typists busy] = p[n ≥ m]
Where n = no. of customer in the system
Related Topics