Chapter: Introduction to Human Nutrition: Food Composition
Overcoming the inadequacies of food composition tables
Overcoming the inadequacies of food composition tables
Nutrient losses and gains during food processing and preparation
In the absence of analytical data for all forms of foods nutrient values can be estimated by calculation using standard algorithms that have been experimentally derived. Since the content of nutrients per unit mass of food changes when foods are prepared, such losses and gains can be classified in two ways. The first can be described by a food yield factor, when the weight of the primary ingredients at the precooking stage is compared with the weight of the prepared food at the cooking stage and also with the final weight of the food as consumed at the post-cooking stage. The weight of the food can be increased due to the hydra-tion of the dry form of a food (e.g., rice, macaroni) with cooking liquid, (e.g., water or broth) or increased due to the absorption of fat during frying of the food (e.g., potato). Alternatively, the weight of the food can decrease due to dehydration during cooking as a result of evaporative and drip losses.
The second, the nutrient retention factor, is related to changes in the amount of specific nutrients when foods are prepared. Changes in the nutrient levels can occur due to partial destruction of the nutrient as a result of the application of heat, alkalization, etc. Also, for some dietary components (e.g.β-carotene) the amount of available component may increase due to the breakdown of cell walls in the plant-based sample. Although original analytical data would be the most desirable type of data for foods at all stages of prepa-ration, they are seldom available. Efforts are in prog-ress in several regions to revise the nutrient losses and gain factors, including nutrient retention and yield factors, in order to compare and harmonize them and thereby improve the quality of food composition data calculated.
As food composition data are frequently lacking for cooked foods, estimates based on the use of these factors for calculating the nutrient content of prepared foods from raw ingredients are made. Thus, the nutrient composition of a prepared or cooked food is calculated from the analytical data of uncooked food by applying suitable nutrient retention and yield factors. To obtain the nutrient content per 100 g of cooked food, the nutrient content per 100 g of raw food is multiplied by the percentage retained after cooking, and this is divided by the percentage retained after cooking, divided by the percentage yield* of the cooked product:
Nutrient content of cooked food per 100 g = [(nutrient content of raw food × retention factor)/yield of cooked food] × 100
The retention factor accounts for the loss of solids from foods that occurs during preparation and cooking. The resulting values quantify the nutrient content retained in a food after nutrient losses due to heating or other food preparations. This is called the true retention method and is calculated as follows:
%True retention = [(nutrient content per g of cooked food × g cooked food)/(nutrient content per g of raw food/g of food before cooking)] × 100
The following example uses only the yield factor to predict the nutrient content of the cooked food. The yield factors for different foods are reported in the USDA Agriculture Handbook 102 and for cooked carrots it is 92%. Selected nutrient values in SR 21 for 100 g of raw carrots are 0.93 g of protein, 33 mg of calcium and 5.9 mg of ascorbic acid. Using the yield factor the composition of 100 g of cooked carrots is calculated as 0.93 g/0.92 = 1.01 g protein, 33 mg/0.92= 36 mg calcium and 5.9 mg/0.92 = 6.4 mg of ascorbic acid. This compares favorably to the deter-mined values for carrots of 0.76 g of protein and 30 mg of calcium, but less so for ascorbic acid at a value of 3.6 mg, probably because it is heat sensitive; therefore, applying the nutrient retention factor for ascorbic acid (70%) would have resulted in a more accurate prediction (5.9 × 0.7/0.92 = 4.9) of 4.9 mg/100 g) (http://www.ars.usda.gov/nutrientdata).
Missing values in food composition tables
In general, original analytical data provide informa-tion of the highest quality for inclusion in a food composition table or nutrient database. However, it is seldom possible to construct a food composition table with only such data. A plan of action should be devel-oped by the compilers of the database to deal with missing food items and values for particular nutrients. Very often, values of a biologically similar food are used. For composite or mixed dishes the composition of the dish is estimated by calculation from a standard recipe and applying appropriate nutrient retention factors and, in some cases, adjusting for changes in moisture content due to cooking loss or gain in the different cooking procedures. If a food item forms an important part of the population’s diet and analysis is not possible, existing food composition databases should be searched to see whether data on the same or a similar food item could be borrowed. If a value for a nutrient is missing a similar approach can be followed, as it is more desirable to have a slightly incorrect esti-mated value of lower quality than no value at all. A value of “–” or “0” assigned to missing nutrient values may lead to underestimation of nutrient intakes, especially if those nutrients make a significant contribution to the diet.
Bioavailability and glycemic index
Nutrient composition information in food composi-tion tables indicates the amount of nutrients as ana-lyzed in that specific food sample and does not give an indication of the absorption or bioavailability of the nutrient from that food item. However, when dietary reference intakes such as recommended dietary allow-ances (RDAs) are drawn up, the recommendation makes provision for the amount of ingested nutrient that may not be absorbed. The concept of bioavail-ability has developed from observations that measure-ments of the amount of a nutrient consumed do not necessarily provide a good index of the amount of a nutrient that can be utilized by the body. The bioavail-ability of a nutrient can be defined as the proportion of that nutrient ingested from a particular food that can be absorbed and is available for utilization by the body for normal metabolic functions. This is not simply the proportion of a nutrient absorbed, and cannot be equated with solubility or diffusibility in invitro-simulatedphysiologicalsystems.Bioavailability is not a property of a food or of a diet per se, but is the result of the interaction between the nutrient in ques-tion, other components of the diet and the individual consuming the diet. Owing to the many factors
influencing bioavailability, tables of food composition cannot give a single value for a nutrient’s bioavailabil-ity. Most research until now has centered upon inor-ganic constituents, particularly iron, but the concept is applicable to virtually all nutrients. Iron incorpo-rated into heme is more readily absorbed than iron in the nonheme form, and these two forms of iron are sometimes listed separately in food composition tables. Yet, such information does not take into account, for example, the effect of ascorbic acid (vitamin C) and organic acids (citric, malic, tartaric, and lactic acid) on nonheme iron absorption. Iron absorption is also increased in a state of iron defi-ciency and research has shown that vitamin A and iron intake has to be increased simultaneously to alleviate anemia. In the coming years, it can be expected that much more work will be carried out on bioavailability than in the past, because of its key role in relating functional nutritional status to nutrient intake.
Future research will probably also focus more on the measurement of the bioavailability of food con-stituents. Several vitamins and minerals, such as calcium, iron, zinc, and a number of B vitamins, are already being studied, with limited attention to carot-enoid bioavailability. Inhibitors of absorption and the effects of processing and storage on the foodstuffs must be determined. As bioavailability is also influ-enced to a large extent by the meal in which a food constituent is consumed, this means that more infor-mation will be needed not only on daily food con-sumption but also on intake of other constituents at individual meals.
There is an increasing demand from users of food composition tables for information on the glycemic index (GI) of food, which is used as a tool in the selection of food in the management of diabetes, as opposed to the previous system of carbohydrate exchange. The GI is a food-specific measure of the relative tendency of carbohydrate in food to induce postprandial glycemia. The body’s response to a 50 g carbohydrate dose induced by either glucose or white bread is taken as the reference and assigned a value of a 100. Responses to all other foods are rated in com-parison and listed in tabular format. New datasets with complementary values, based on the GI and available carbohydrate content of food, have been proposed, of which one is a measure of the relative glycemic response to a given mass of whole food and the other is the mass of a food responsible for a given specific glycemic response. A more recently proposed identification of a food’s GI value lies in indicating the specific food’s category of GI as high, medium, or low. Accurate numerical values of a food’s GI are dif-ficult to obtain as various factors, including human subject variability both between and within subjects during analysis as well as response during ingestion of the food, can differ significantly.
Both bioavailability and GI are food indices that are influenced not only by the characteristics of the food, but also by the response of the individual to the food (i.e., absorption, metabolism, and excretion of the metabolites). For example, quantitative analysis of carotenoids alone could lead to a misinterpretation of vitamin A value. Therefore, the bioavailability of test foods in a single mixture may be investigated using the digestive system of nutrient-depleted rats (i.e., measuring retinol accumulation factor as a measure of total carotenoid bioavailability), or in humans using the relative dose–response test. Advances in analytical chemistry such as improvements in analyti-cal methods, information science, computer hardware and software will assist in filling these gaps in special-purpose databases in the future.
How to calculate a recipe not included in the database
If the composition of a composite or mixed dish is not known, it can be estimated by calculation from a standard recipe and applying appropriate nutrient retention factors and, in some cases, adjusting for changes in moisture content due to cooking loss or gain during cooking. The following guidelines are suggested.
● Identify the ingredients of the recipe from the most appropriate foods available in the food composition database table.
● Quantify the ingredients in mass (g).
● Calculate the nutrient values for the specific amount of each ingredient.
● Add up the nutrient values of the individual ingredients.
● Calculate the nutrient composition for 100 g of the recipe.
● Apply suitable retention factors to the mineral and vitamin nutrient values if the recipe food is cooked. Note that if individual ingredients are in a cooked form this step is not necessary.
● Compare the moisture content of the calculated recipe with a similar cooked composite dish. If the moisture content differs by more than 1%, adjust the moisture content of the recipe food. All of the nutrients of the recipe food must be adjusted (concentrated or diluted) according to either the decrease or increase in moisture content.
● Assign to a suitable food group and list.
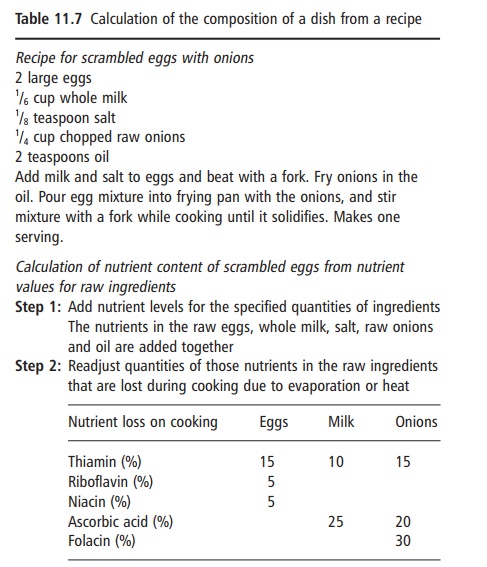
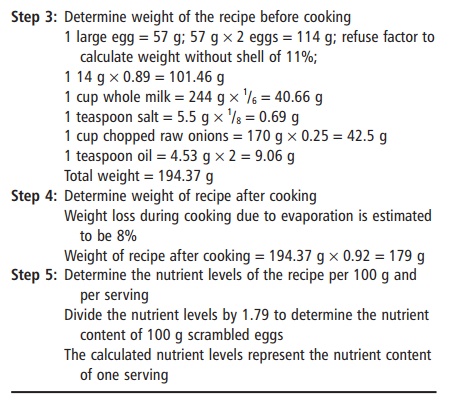
This is only an estimation of the make-up of a com-posite or mixed dish of unknown composition. Refer to Table 11.7 for an example of the calculation of the composition of a dish from a recipe. However, if this dish is a very important part of the diet of an indi-vidual or group and the information is crucial in assessing the adequacy of the diet, analysis should be considered.
Accurate estimation of portion size
Food composition tables and databases are mainly used in nutritional epidemiology to estimate the composition of foods consumed by individuals. All subjects have difficulties in estimating the exact portion sizes of food consumed. This issue is further complicated by the difference between the weight of a product as purchased and that of the actual item consumed (e.g., in meat after cooking there is at least a 25% cooking loss, without bone and with or without visible fat). Standardized portion sizes for individual foods within countries may help, but a set of standard food models (small, medium, and large) for use in dietary assessment may be of more value.
Related Topics