Chapter: Data Warehousing and Data Mining : Business Analysis
Multidimensional Data Model
Multidimensional Data Model
The multidimensional data model is an integral part of On-Line Analytical Processing, or OLAP
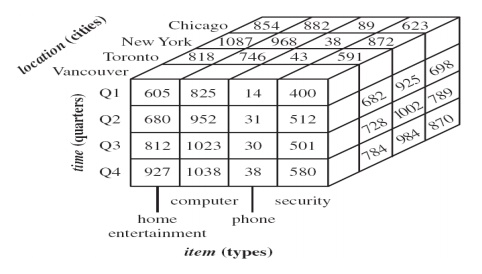
Multidimensional data model is to view it as a cube. The cable at the
left contains detailed sales data by product, market and time. The cube on the
right associates sales number (unit sold) with dimensions-product type, market and
time with the unit variables organized as cell in an array.
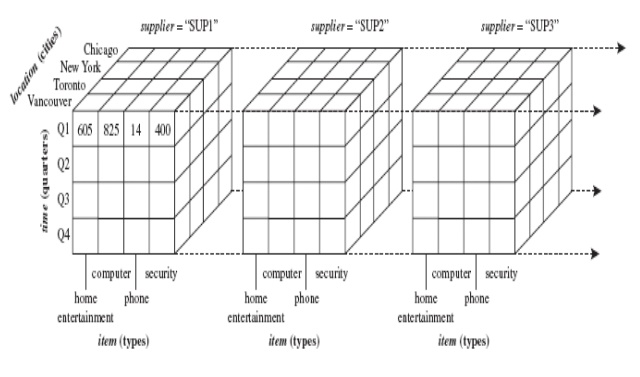
This cube can be expended to include another array-price-which can be
associates with all or only some dimensions. As number of dimensions increases
number of cubes cell increase exponentially.
Dimensions are hierarchical in nature i.e. time dimension may contain
hierarchies for years, quarters, months, weak and day. GEOGRAPHY may contain
country, state, city etc.
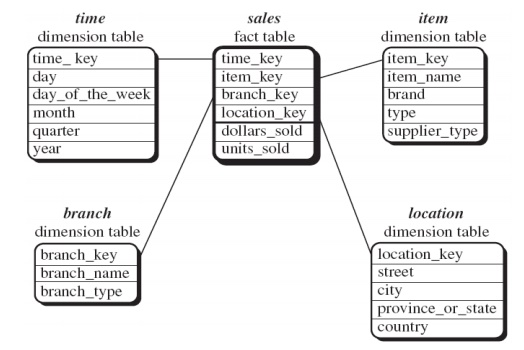
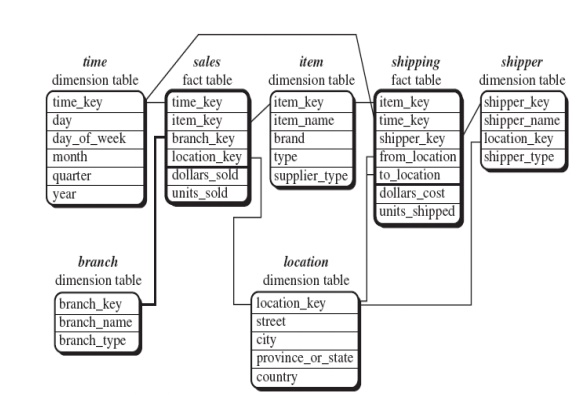
Star schema: A fact
table in the middle connected to a set of dimension tables It contains:
A large
central table (fact table)
A set of
smaller attendant tables (dimension table), one for each dimension
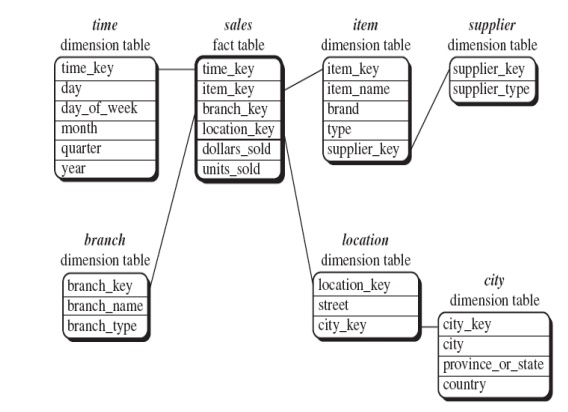
Snowflake schema: A refinement of star schema where
some dimensional hierarchy is further
splitting (normalized) into a set of smaller dimension tables, forming a shape
similar to snowflake
However,
the snowflake structure can reduce the effectiveness of browsing, since more
joins will be needed
Fact constellations: Multiple
fact tables share dimension tables, viewed as a collection of stars, therefore called galaxy schema or fact
constellation
In this cube we can observe, that each side of the cube represents one
of the elements of the question. The x-axis represents the time, the y-axis
represents the products and the z-axis represents different centers. The cells
of in the cube represents the number of product sold or can represent the price
of the items.
This Figure also gives a different understanding to the drilling down
operations. The relations defined must not be directly related, they related
directly.
The size of the dimension increase, the size of the cube will also
increase exponentially. The time response of the cube depends on the size of
the cube.
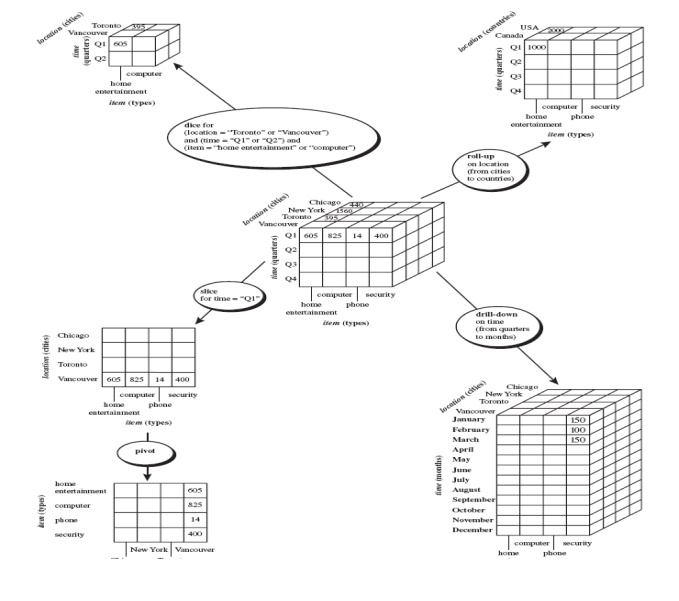
Operations in Multidimensional
Data Model:
Aggregation (roll-up)
dimension
reduction: e.g., total sales by city
summarization
over aggregate hierarchy: e.g., total sales by city and year -> total sales
by region and by year
Selection (slice)
defines a subcube
e.g.,
sales where city = Palo Alto and date = 1/15/96
Navigation to detailed data (drill-down)
e.g.,
(sales – expense) by city, top 3% of cities by average income
Visualization Operations (e.g., Pivot or dice)
Related Topics