Chapter: Transmission and Distribution : Mechanical Design of Lines and Grounding
Mechanical Design of Transmission Line
MECHANICAL DESIGN OF TRANSMISSION LINE
1. SAG IN OVERHEAD LINES
While erecting an overhead line, it is very important that conductors are under safe tension. If the conductors are too much stretched between supports in a bid to save conductor material, the stress in the conductor may reach unsafe value and in certain cases the conductor may break due to excessive tension. In order to permit safe tension in the conductors, they are not fully stretched but are allowed to have a dip or sag. The difference in level between points of supports and the lowest point on the conductor is called sag. Following Fig. shows a conductor suspended between two equal level supports A and B. The conductor is not fully stretched but is allowed to have a dip. The lowest point on the conductor is O and the sag is S. The following points may be noted
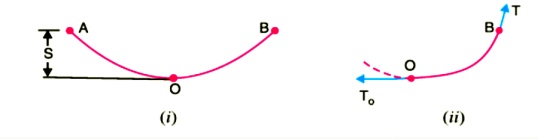
(i) When the conductor is suspended between two supports at the same level, it takes the shap e of catenary. However, if the sag is very small compared with the span, then sag-span curve is like a parabola.
(ii) The tension at any point on the conductor acts tangentially. Thus tension TO at the lowest Point O acts horizontally as shown in Fig. (ii).
(iii) The horizontal component of tension is constant throughout the length of the wire.
(iv)The tension at supports is approximately equal to the horizontal tension acting at any point on the wire. Thus if T is the tension at the support B, then T = TO
Conductor Sag And Tension
This is an important consideration in the mechanical design of overhead lines. The conductor sag should be kept to a minimum in order to reduce the conductor material required and to avoid extra pole height for sufficient clearance above ground level. It is also desirable that tension in the conductor should be low to avoid the mechanical failure of conductor and to permit the use of less strong supports. However, low conductor tension and minimum sag are not possible. It is because low sag means a tight wire and high tension, whereas a low tension means a loose wire and increased sag. Therefore, in actual practice, a compromise in made between the two.
2. CALCULATION OF SAG
In an overhead line, the sag should be so adjusted that tension in the conductors is within safe limits. The tension is governed by conductor weight, effects of wind, ice loading and temperature variations. It is a standard practice to keep conductor tension less than 50% of its ultimate tensile strength i.e., minimum factor of safety in respect of conductor tension should be 2. We shall now calculate sag and tension of a conductor when ( i ) supports are at equal levels and ( ii ) supports are at unequal levels.
When supports are at equal levels .Consider a conductor between two equilevel supports A and B with O as the lowest point as shown in Fig.8.2. It can be proved that lowest point will be at a conductor between two equilevel supports A and B with O as the lowest point as shown in Fig. It can be proved that lowest point will be at the mid-span.
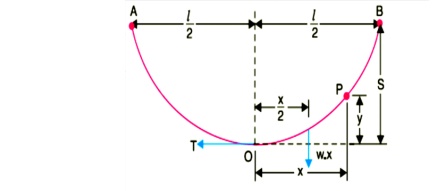
a conductor between two equilevel supports A and B with O as the lowest point as shown in Fig. It can be proved that lowest point will be at the mid-span.
Let
l = Length of span
w = Weight per unit length of conductor
T = Tension in the conductor.
Consider a point P on the conductor. Taking the lowest point O as the origin, let the co-ordinates of point P be x and y. Assuming that the curvature is so small that curved length is equal to its horizontal projection ( i.e., OP = x ), the two forces acting on the portion OP of the conductor are :
(a)The weight wx of conductor acting at a distance x/2 from O.
(b) The tension T acting at O .
Equating the moments of above two forces about point O, we get,
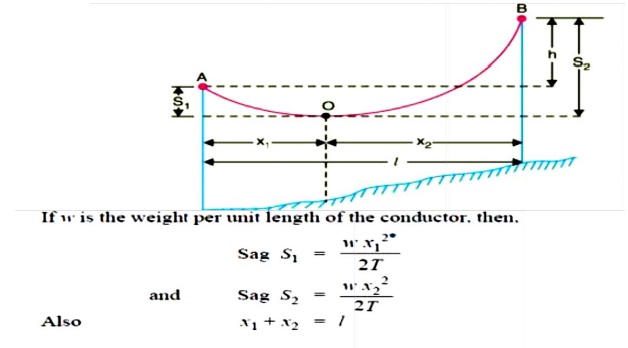
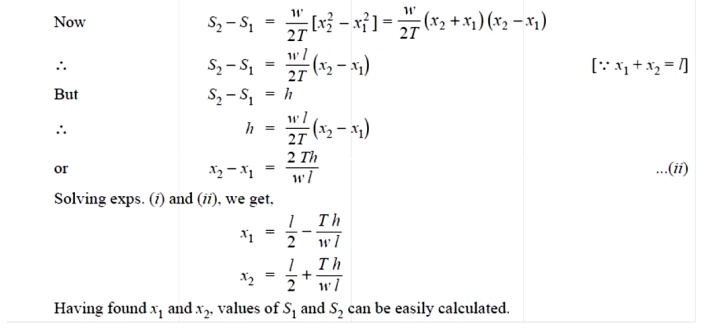
( ii ) When supports are at unequal levels. In hilly areas, we generally come across conductors suspended between supports at unequal levels. Fig.3 shows a conductor suspended between two supports A and B which are at different levels. The lowest point on the conductor is O .
Let
l = Span length
h = Difference in levels between two supports
x 1 = Distance of support at lower level ( i.e., A ) from O
x 2 = Distance of support at higher level ( i.e. B ) from O
T = Tension in the conductor
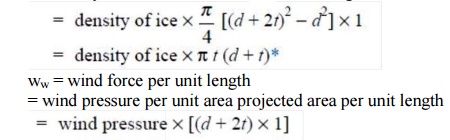
3. EFFECT OF WIND AND ICE LOADING
The above formulae for sag are true only in still air and at normal temperature when the conductor is acted by its weight only. However, in actual practice, a conductor may have ice coating and simultaneously subjected to wind pressure. The weight of ice acts vertically downwards i.e. , in the same direction as the weight of conductor. The force due to the wind is assumed to act horizontally i.e ., at right angle to the projected surface of the conductor. Hence, the total force on the conductor is the vector sum of horizontal and vertical forces as shown in
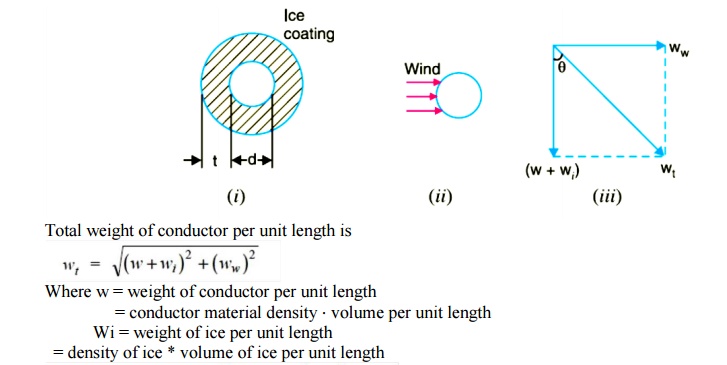
When the conductor has wind and ice loading also, the following points may be noted :
i)The conductor sets itself in a plane at an angle to the vertical where
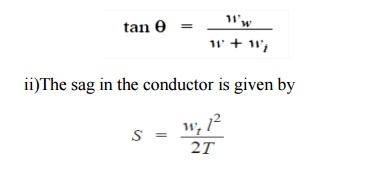
Hence S represents the slant sag in a direction making an angle to the vertical. If no specific mention is made in the problem, then slant slag is calculated by using the above formula.
4. VIBRATION DAMPER
Aeolian vibrations mostly occur at steady wind velocities from 1 to 7 m/s. With increasing wind turbulences the wind power input to the conductor will decrease. The intensity to induce vibrations depends on several parameters such as type of conductors and clamps, tension, span length, topography in the surrounding, height and direction of the line as well as the frequency of occurrence of the vibration induced wind streams. In the wake of wind power plants (up to 3 x diameter of the rotor behind the plant) the wind velocity will be reduced up to 0,5 of the velocity of the free wind stream, so that lower wind velocities could be expected more frequently here. That’s why the probability of a higher stresses for the conductors caused by wind-induced vibrations will be greater than without wind power plants. On the other hand the intensity of turbulences will increase which will hinder the arising of vibrations. The both important parameters for inducing vibrations, wind velocity and turbulence intensity, depends on the distance to the rotor and the height of it.
The investigations showed an increasing of damage probability on OHTL due to the wake of wind power plants of the factor 2,5 to 3,5 between one and three rotor diameters behind the plant which will cause an equivalent decreasing of lifetime of conductors and earth wires.
Vibration Damping
The knowledge of the mechanical self- damping of conductors is an important parameter for the energy balance calculation. The impedance and the efficiency of the vibration damper have been measured in relationship to frequency and used as input data for the energy balance.
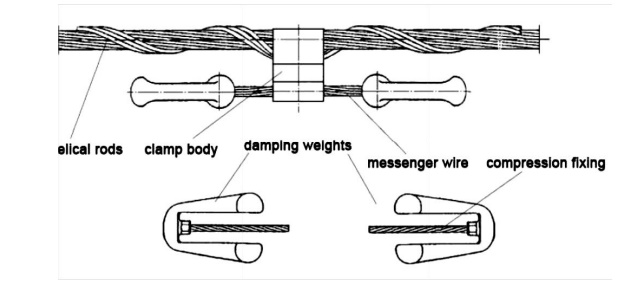
The velocity of the damper clamp shall be remain under the limit of 10 cm/s. The vibration dampers are tested at this vibrating velocity in an endurance test. They must stand at least 100 million vibrations without damages. If the velocity of the damper clamp remains beneath the value of 10 cm/s the bending stresses remain in the endurance range so that damages could not be expected.
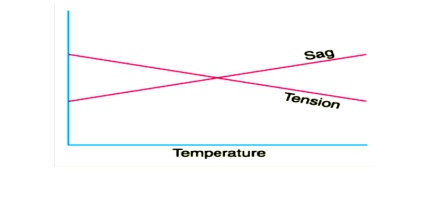
5. STRINGING CHART
For use in the field work of stringing the conductors, temperature-sag and temperature tension charts are plotted for the given conductor and loading conditions. Such curves are called stringing charts (see Fig). These charts are very helpful while stringing overhead lines.
6. SAG TEMPLATE
A Sag Template is a very important tool with the help of which the position of towers on the Profile is decided so that they conform to the limitations of vertical and wind loads on any particular tower, and minimum clearances, as per I.E. Rules, required to be maintained between the line conductor to ground, telephone lines, buildings, streets, navigable canals, power lines, or any other object coming under or near the line.
A Sag Template is specific for the particular line voltage, the conductor used and the applicable design conditions. Therefore, the correct applicable Sag Template should be used. A Sag Template consists of a set of parabolic curves drawn on a transparent celluloid or a crylic clear sheet duly cut in over the maximum conductor sag curve to allow the conductor curve to be drawn and the lowest points of the conductor sag to be marked on the profile when the profile is placed underneath it.
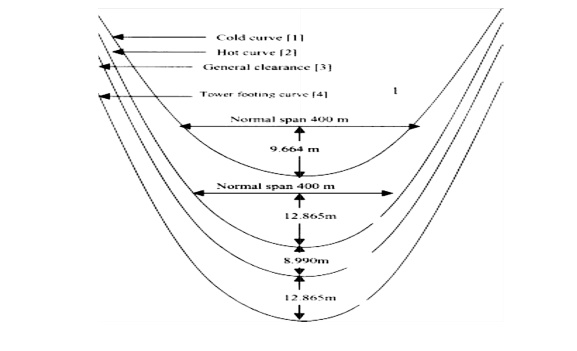
The set of curves in the sag template consists of:
a) Cold or Uplift Curve’ showing sag of conductor at minimum temperature (minus 2.5ºC) and still wind.
b) Hot or Maximum Sag Curve’ showing maximum sag of conductor at maximum temperature and still wind including sag tolerances allowed (normally 4%), if any, and under maximum ice condition wherever applicable.
c) Ground Clearance Curve’ which is drawn parallel to the ‘Hot or Maximum Sag Curve’ and at a distance equal to the specified minimum ground clearance for the relevant voltage.
d) ‘Tower Footing Curve’ which is drawn parallel to the ‘Ground Clearance Curve’ and separated by a minimum distance equal to the maximum sag at the basic design span.
Related Topics