Chapter: 11th 12th std standard Indian Economy Economic status Higher secondary school College
Long run Average Cost Curve (LAC)
Long run Average Cost Curve (LAC)
In the long-run all factors are variable. Therefore the firm
can change the size of the plant (capital equipment, machinery etc) to meet the
changes in demand. A long-run average cost curve depicts the functional
relationship between output and the long-run cost of production.
Long-run average cost curve
The Long run Average Cost (LAC) Curve is based on the
assumption that in the long run a firm has a number of alternatives with regard
to the scale of operations. For each scale of production or plant size, the
firm has an appropriate short-run average cost (SAC) curve.
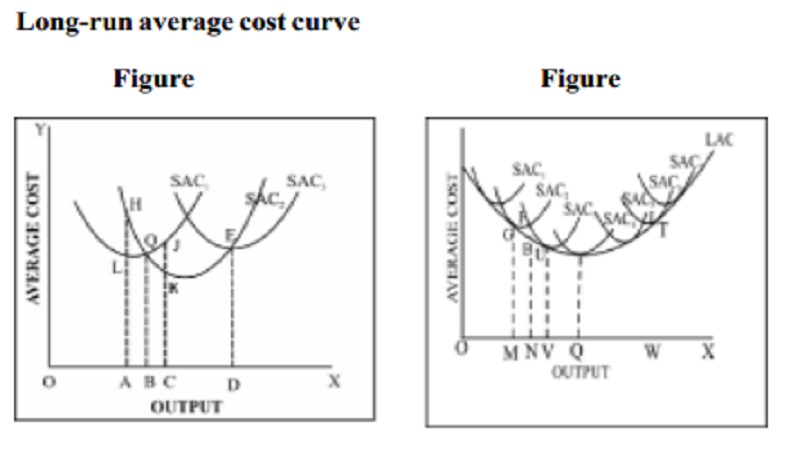
The
pattern of these short-run average cost curves is shown in Figure . We have
assumed that technologically there are only three sizes of plants - small,
medium and large. SAC1 is relevant for a small size plant, SAC2
for a medium size plant and SAC3 for a large size plant. In the
short period, when the output demanded is OA, the firm will choose the smallest
size plant. But for an output beyond OB, the firm will choose medium size plant
as the average cost of small size plant is higher for the same output
(JC>KC). For output beyond OD, the firm will choose large size plant (SAC3).
In the short-run, the firm is tied with a given plant but in the long-run, the
firm moves from one plant to another. As the scale of production is changed, a
new plant is added. The long-run cost of production is the least possible cost
of production of any given level of output, when all inputs become variable,
including the size of the plant.
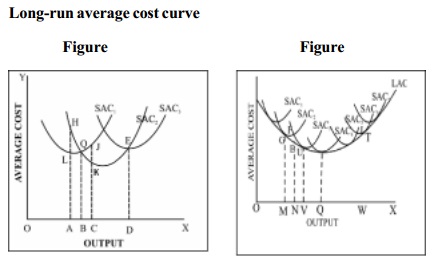
The long run average cost curve is called 'planning curve'
of a firm as it helps in choosing a plant on the decided level of output. The
long-run average cost curve is also called envelope curve as it supports or
envelops a group of short-run cost curves (Figure ). From the figure we can
understand that the long run average cost curve initially falls with increase
in output and after a certain point it rises making a boat shape.
Related Topics