Chapter: Mechanical : Engineering Economics & Cost Analysis : Cash Flow
Cash Flow: Bases for Comparison of Alternatives
CASH FLOW
Introduction
In this method of comparison, the
cash flows of each alternative will be reduced to time zero by assuming an
interest rate i. Then, depending on the type of decision, the best alternative
will be selected by comparing the present worth amounts of the alternatives.
The sign of various amounts at
different points in time in a cash flow diagram is to be decided based on the
type of the decision problem.
In a cost dominated cash flow
diagram, the costs (outflows) will be assigned with positive sign and the
profit, revenue, salvage value (all inflows), etc. will be assigned with
negative sign.
In a revenue/profit-dominated cash
flow diagram, the profit, revenue, salvage value (all inflows to an
organization) will be assigned with positive sign. The costs (outflows) will be
assigned with negative sign.
In case the decision is to select
the alternative with the minimum cost, then the alternative with the least
present worth amount will be selected. On the other hand, if the decision is to
select the alternative with the maximum profit, then the alternative with the
maximum present worth will be selected.
BASES FOR COMPARISON OF ALTERNATIVES
In most of the practical decision
environments, executives will be forced to select the best alternative from a
set of competing alternatives.
Let us assume that an organization
has a huge sum of money for potential investment and there are three different
projects whose initial outlay and annual revenues during their lives are known.
The executive has to select the best alternative among these three competing
projects.
There are several bases for comparing the worthiness of the
projects. These bases are:
1. Present worth method
2. Future worth method
3. Annual equivalent method
4. Rate of return method
1.PRESENT WORTH METHOD
ü In this method of comparison, the cash flows of each alternative
will be reduced to time zero by assuming an interest rate i.
ü Then, depending on the type of decision, the best alternative
will be selected by comparing the present worth amounts of the alternatives.
In a cost dominated cash flow diagram, the costs
(outflows) will be assigned with positive sign and the profit, revenue, salvage
value (all inflows), etc. will be assigned with negative sign.
ü In a revenue/profit-dominated cash flow diagram, the profit,
revenue, salvage value (all inflows to an organization) will be assigned with
positive sign. The costs (outflows) will be assigned with negative sign.
a.Revenue-Dominated Cash Flow
Diagram
A generalized revenue-dominated cash flow diagram to demonstrate
the present worth method of comparison is presented in Fig.
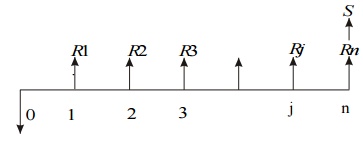
To find the present worth of the
above cash flow diagram for a given interest rate, the formula is
PW(i) = – P + R1[1/(1 + i)1]
+ R2[1/(1 + i)2] + ...
+ Rj [1/(1 + i) j]
+ Rn[1/(1 + i)n] + S[1/(1 + i)n]
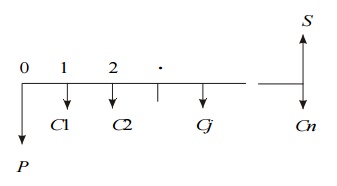
b.Cost-Dominated Cash Flow Diagram
A generalized cost-dominated cash
flow diagram to demonstrate the present worth method of comparison is presented
in Fig.
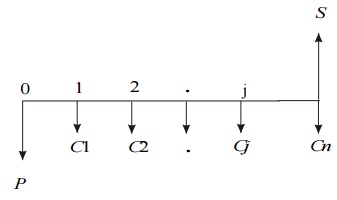
To compute the present worth amount
of the above cash flow diagram for a given interest rate i, we have the
formula
PW(i) = P + C1[1/(1
+ i)1] + C2[1/(1 + i)2] + ... +
Cj[1/(1 + i) j]
+ Cn[1/(1 + i)n] – S[1/(1 + i)n]
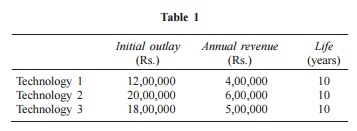
EXAMPLE
Alpha Industry is planning to expand its production operation.
It has identified three different technologies for meeting the goal. The
initial outlay and annual revenues with respect to each of the technologies are
summarized in Table 1. Suggest the best technology which is to be implemented
based on the present worth method of comparison assuming 20% interest rate,
compounded annually.
Solution
In all the technologies, the initial
outlay is assigned a negative sign and the annual revenues are assigned a
positive sign.
TECHNOLOGY 1
Initial outlay, P = Rs. 12,00,000
Annual revenue, A = Rs. 4,00,000
Interest rate, i = 20%, compounded annually
Life of this technology, n = 10 years
The cash flow diagram of this technology is as shown in Fig. 4.3.
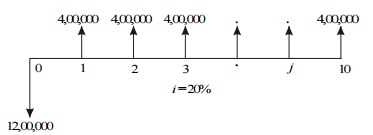
Fig. Cash flow diagram for technology 1.
The present worth expression for this technology is
PW(20%)1 = –12,00,000 +
4,00,000 (P/A, 20%, 10)
= –12,00,000 + 4,00,000 (4.1925)
= –12,00,000 + 16,77,000
= Rs. 4,77,000
TECHNOLOGY 2
Initial outlay, P = Rs. 20,00,000
Annual revenue, A = Rs. 6,00,000
Interest rate, i = 20%, compounded annually
Life of this technology, n = 10 years
The cash flow diagram of this technology is shown in Fig. 4.4.
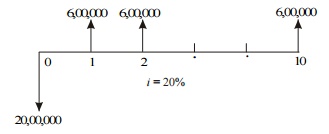
Fig. Cash flow diagram for
technology 2.
The present worth expression for this technology is
PW(20%)2 = – 20,00,000 + 6,00,000 (P/A,
20%, 10)
= – 20,00,000 +
6,00,000 (4.1925)
= – 20,00,000 +
25,15,500
= Rs. 5,15,500
TECHNOLOGY 3
Initial outlay, P = Rs. 18,00,000
Annual revenue, A = Rs. 5,00,000
Interest rate, i = 20%, compounded annually
Life of this technology, n = 10 years
The cash flow diagram of this technology is shown in Fig. 4.5.
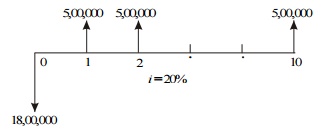
Fig. Cash flow diagram
for technology 3.
The present worth expression for this technology is
PW(20%)3 = –18,00,000 + 5,00,000 (P/A, 20%, 10)
= –18,00,000 +
5,00,000 (4.1925)
= –18,00,000 +
20,96,250
= Rs. 2,96,250
From the above calculations, it is clear that the present worth
of technology 2 is the highest among all the technologies. Therefore,
technology 2 is suggested for implementation to expand the production.
2. FUTURE WORTH METHOD
ü In the future worth method of comparison of alternatives, the
future worth of various alternatives will be computed.
ü Then, the alternative with the maximum future worth of net
revenue or with the minimum future worth of net cost will be selected as the
best alternative for implementation.
i.Revenue-Dominated Cash Flow Diagram
A generalized revenue-dominated cash flow diagram to demonstrate
the future worth method of comparison is presented in Fig.
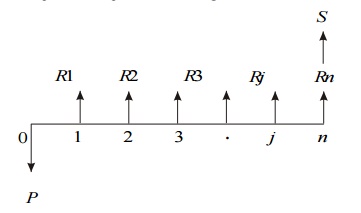
In Fig. P
represents an initial investment, Rj the net-revenue at the end of the jth
year, and S the salvage value at the end of the nth year.
The formula for the future worth of the above cash flow diagram
for a given interest rate, i is
FW(i) = –P(1 + i)n + R1(1 + i)n–1 + R2(1 + i)n–2 + ...
+ R j(1 + i)n–j + ... + Rn + S
In the above
formula, the expenditure is assigned with negative sign and the revenues are
assigned with positive sign.
ii.Cost-Dominated
Cash Flow Diagram
A generalized cost-dominated cash flow diagram to demonstrate
the future worth method
of comparison is given
in Fig.
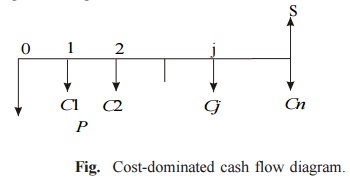
In Fig. 5.2, P represents an
initial investment, Cj the net cost of operation and maintenance at the
end of the j th year, and S the salvage value at the end of the nth
year.
The formula for the future worth of
the above cash flow diagram for a given interest rate, i is
FW(i) = P(1 + i)n + C1(1
+ i )n–1 + C2(1
+ i)n–2 + ... + Cj(1 + i)n–j + ... + Cn – S
EXAMPLE
Consider the following two mutually exclusive alternatives:
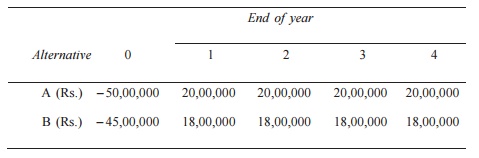
At i = 18%, select the best alternative
based on future worth method of comparison.
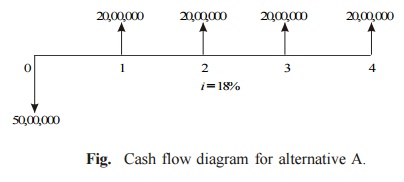
Solution Alternative A
Initial investment, P = Rs. 50,00,000
Annual equivalent revenue, A = Rs. 20,00,000
Interest rate, i = 18%, compounded annually
Life of alternative A = 4 years
The cash flow diagram of alternative A is shown in Fig.
The future worth amount of alternative B is computed as
FWA(18%) = –50,00,000(F/P, 18%, 4)
+ 20,00,000(F/A, 18%, 4)
= –50,00,000(1.939) + 20,00,000(5.215)
= Rs. 7,35,000
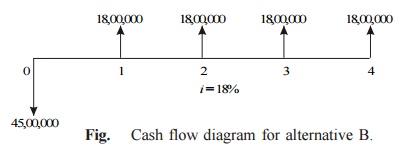
Alternative B
Initial investment, P = Rs. 45,00,000
Annual equivalent revenue, A = Rs. 18,00,000
Interest rate, i = 18%, compounded annually
Life of alternative B = 4 years
The cash flow diagram of alternative B is illustrated in Fig..
The future worth amount of alternative B is computed as
FWB(18%) = – 45,00,000(F/P, 18%, 4)
+ 18,00,000 (F/A, 18%, 4)
= – 45,00,000(1.939) + 18,00,000(5.215)
= Rs. 6,61,500
3.ANNUAL EQUIVALENT
METHOD
ü In the annual equivalent method of comparison, first the annual
equivalent cost or the revenue of each alternative will be computed.
ü Then the alternative with the maximum annual equivalent revenue
in the case of revenue-based comparison or with the minimum annual equivalent
cost in the case of cost- based comparison will be selected as the best
alternative.
i.Revenue-Dominated Cash Flow Diagram
A generalized revenue-dominated cash flow diagram to demonstrate
the annual equivalent method of comparison is presented in Fig.
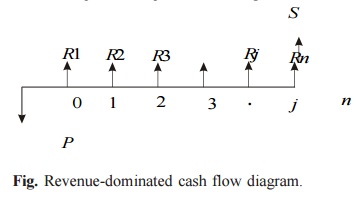
Fig. Revenue-dominated cash flow diagram.
In Fig. P represents an
initial investment, Rj the net revenue at the end of the j th
year, and S the salvage value at the end of the nth year.
The first step is to find the net
present worth of the cash flow diagram using the following expression for a
given interest rate, i:
PW(i) = –P + R1/(1 + i)1 + R2/(1 + i)2 + ...
+ Rj/(1 + i) j + ... + Rn/(1 + i)n + S/(1 + i)n
In the above formula, the expenditure is assigned with a
negative sign and the revenues are assigned with a positive sign.
ii.Cost-Dominated Cash Flow Diagram
A generalized cost-dominated cash flow diagram to demonstrate
the annual equivalent method of comparison is illustrated in Fig.
In Fig, P represents an
initial investment, Cj the net cost of operation and maintenance at the
end of the jth year, and S the salvage value at the end of the nth
year.
The first step is to find the net
present worth of the cash flow diagram using the following relation for a given
interest rate, i.
PW(i) = P + C1/(1
+ i)1 + C2/(1
+ i)2 + ...
+ Cj/(1 + i) j + ... + Cn/(1 + i)n – S/(1 + i)n
EXAMPLE
A company provides a car to its
chief executive. The owner of the company is concerned about the increasing
cost of petrol. The cost per litre of petrol for the first year of operation is
Rs. 21. He feels that the cost of petrol will be increasing by Re.1 every year.
His experience with his company car indicates that it averages 9 km per litre
of petrol. The executive expects to drive an average of 20,000 km each year for
the next four years. What is the annual equivalent cost of fuel over this
period of time?. If he is offered similar service with the same quality on
rental basis at Rs. 60,000 per year, should the owner continue to provide
company car for his executive or alternatively provide a rental car to his
executive? Assume i = 18%. If the rental car is preferred, then the
company car will find some other use within the company.
Solution
Average number of km run/year = 20,000 km
Number of km/litre of petrol = 9 km
Therefore,
Petrol consumption/year = 20,000/9 = 2222.2 litre
Cost/litre of petrol for the 1st year = Rs. 21
Cost/litre of petrol for the 2nd year = Rs. 21.00 + Re. 1.00
=
Rs. 22.00
Cost/litre
of petrol for the 3rd year = Rs. 22.00 +
Re. 1.00 = Rs. 23.00
Cost/litre
of petrol for the 4th year = Rs. 23.00 +
Re. 1.00 = Rs. 24.00
Fuel
expenditure for 1st year = 2222.2 21 =
Rs. 46,666.20
Fuel
expenditure for 2nd year = 2222.2 22 = Rs. 48,888.40
Fuel
expenditure for 3rd year = 2222.2 23 = Rs. 51,110.60
Fuel
expenditure for 4th year = 2222.2 24 = Rs. 53,332.80
The annual equal increment of the above expenditures is Rs.
2,222.20
(G). The cash flow diagram for this situation is depicted
in Fig.
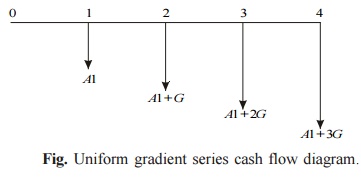
Fig. Uniform gradient series cash flow
diagram.
In Fig., A1 = Rs. 46,666.20 and G
= Rs. 2,222.20
A = A1 + G(A/G, 18%, 4)
= 46,666.20 + 2222.2(1.2947)
= Rs. 49,543.28
The proposal of using the company car by spending for petrol by
the company will cost an annual equivalent amount of Rs. 49,543.28 for four
years. This amount is less than the annual rental value of Rs. 60,000.
Therefore, the company should continue to provide its own car to its executive.
4.RATE OF RETURN METHOD
ü The rate of return of a cash flow pattern is the interest rate
at which the present worth of that cash flow pattern reduces to zero.
ü In this method of comparison, the rate of return for each
alternative is computed. Then the alternative which has the highest rate of
return is selected as the best alternative.
ü A generalized cash flow diagram to demonstrate the rate of
return method of comparison is presented in Fig
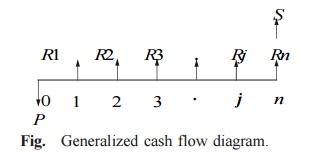
In the above cash flow diagram, P
represents an initial investment, Rj the net revenue at the end of the jth
year, and S the salvage value at the end of the nth year.
The first step is to find the net
present worth of the cash flow diagram using the following expression at a
given interest rate, i.
PW(i) = – P + R1/(1 + i)1 + R2/(1 + i)2 + ...
+ Rj/(1 + i) j + ... + Rn/(1 + i)n + S/(1 + i)n
EXAMPLE
A person is planning a new business. The initial outlay and cash
flow pattern for the new business are as listed below. The expected life of the
business is five years. Find the rate of return for the new business.
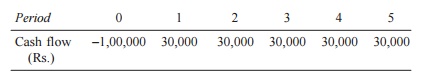
Solution
Initial investment = Rs. 1,00,000 Annual equal
revenue = Rs. 30,000 Life = 5 years
The cash flow diagram for this situation is illustrated in Fig.
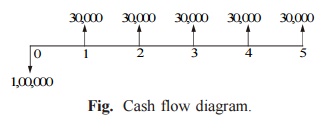
Fig. Cash flow diagram.
The present worth function for the business is
PW(i) = –1,00,000 + 30,000(P/A,
i, 5)
When i = 10%,
PW(10%) = –1,00,000 + 30,000(P/A, 10%, 5)
= –1,00,000 + 30,000(3.7908)
= Rs. 13,724.
When i = 15%,
PW(15%) = –1,00,000 + 30,000(P/A, 15%,
5)
= –1,00,000 +
30,000(3.3522)
= Rs. 566.
When i = 18%,
PW(18%) = –1,00,000 + 30,000(P/A, 18%, 5)
= –1,00,000 +
30,000(3.1272)
= Rs. – 6,184
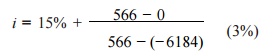
i= 15% + 0.252% = 15.252%
Therefore, the rate
of return for the new business is 15.252%.
Related Topics