Chapter: Automation, Production Systems, and Computer Integrated Manufacturing : Group Technology and Cellular Manufacturing
Quantitative Analysis in Cellular Manufacturing
QUANTITATIVE ANALYSIS IN CELLULAR MANUFACTURING
A number
of quantitative techniques have been developed to deal with problem areas in
group technology and cellular manufacturing. In this section, we consider two
problem areas: (1) grouping parts and machines into families, and (2) arranging
machines in a GT cell. The first problem area has been and still is an active
research area, and several of the more significant research publications are
listed in our references . The technique we
describe in the current section for salving the part and machine grouping
problem is rank order clustering . The second problem area has also been
the subject of research, and several reports are listed in the references.
Grouping Parts and Machines by Rank Order
Clustering
The
problem addressed here is to determine how machines in an existing plant should
be grouped into machine cells. The problem is the same whether the cells are
virtual or formal (Section 15.5.1 ).It is basically the problem of identifying
part families. By identifying part families, the machines required in the cell
to produce the part family can be properly selected. As previously discussed, the
three basic methods to identify part families are (1) visual inspection, (2)
parts classification and coding, and (3) production flow analysis.
The rank order clustering technique. first
proposed by King [26J, is specifically applicable in production flow analysis.
It is an efficient and easy-to-use algorithm for grouping machines into cells.
In a starting part machine incidence matrix that might be compiled to document
the part routings in a machine shop (or other job shop), the occupied locations
in the matrix are organized in a seemingly random fashion. Rank order
clustering works by reducing the part machine incidence matrix to a set of diagonalized
blocks that represent part families and associated machine groups. Starting
with the initial part machine incidence matrix. the algorithm consist, of the
following steps:
In each
row of the matrix. read the series of ls and G's (blank entries = D's) from left to fight as a
binary number. Rank the rows in 01 del uf
decreasing value. In case of a tie, rank the rows in the same order as they
appear in the current matrix
Numbering
from top to bottom, is the current order of rows the same as the rank order
determined in the previous step? If yes, go to step 7, If no, go to the following step.
3,
Reorder the rows in the part-machine incidence matrix by listing them in
decreasing rank order, starting from the top
In each
column of the matrix. read the series of I 's and O's (blank entries = (j's) from top to bottom as a
binary number. Rank the columns in order of decreasing value, In case of a tie.
rank the columns in the same order as they appear in the current matrix.
Numbering
from left to right, is the current order of columns the same as the rank order
determined in the previous step? If yes. go to step 7. If no. go to the
following step.
Reorder
the columns in the part-machine incidence matrix by listing them in decreasing
rank order, starting with the left column. Go to step I.
7 Stop
For
readers unaccustomed to evaluating binary numbers in steps 1 and 4, it might be
helpful to convert each binary value into its decimal equivalent (e.g., the
entries in the first row of the matrix in Table 15.4 are read as 100100(10).
This is converted into its decimal equivalent as follows: lx28 + Ox2' + Ox2b + 1x25 + Ox24 + Ox23 + Ox22
+ Ix2] + Ox2° = 256 + 32 + 2 = 290. It should be mentioned that decimal
conversion becomes impractical for the large numbers of parts found in
practice, and comparison of the binary numbers is preferred
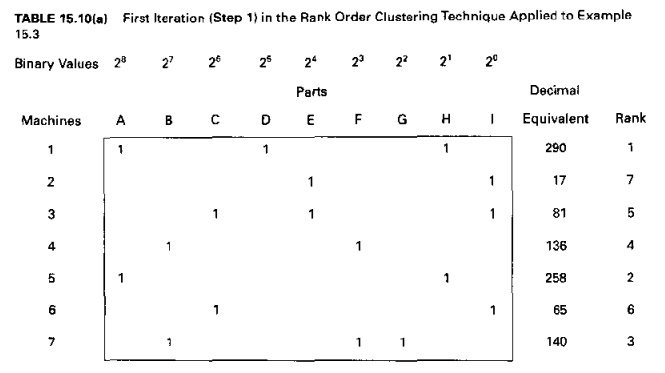
EXAMPLE 15.3 Rank
Order Clustering Technique
Apply the
rank order clustering technique to the part-machine incidence matrix in Table
15.4
Solution: Step I consists of reading the
series of 1's and D's in each row as a binary number. We have done this in
Table 15.10(a). converting the binary value for each row to its decimal
equivalent. The values are then rank ordered in the far right-hand column. In
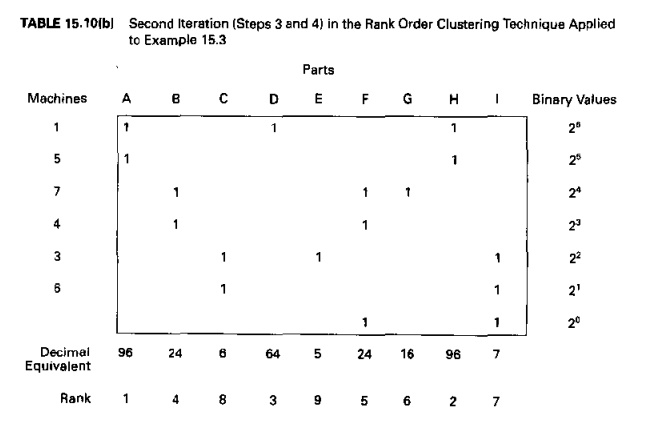
step 2. we see that the row order is different from the starting matrix. We
therefore reorder the rows in step 3. In step 4, we read the series of I's and
D's in each column from top to bottom as a binary number (again we have
converted to the decimal equivalent, and the columns are ranked in order of
decreasing value, as shown in Table 15.10(b).ln step 5, we see that the column
order is different from the preceding matrix. Proceeding from step 6 back to
steps 1 and 2, we see that a reordering of the columns provides a row order
that is in descending value. and the algorithm is concluded (step 7). The final
solution is shown in Table 15.10(c), A
close comparison of this solution with Table 15,5 reveals that they are the
carne part-machine groupings,
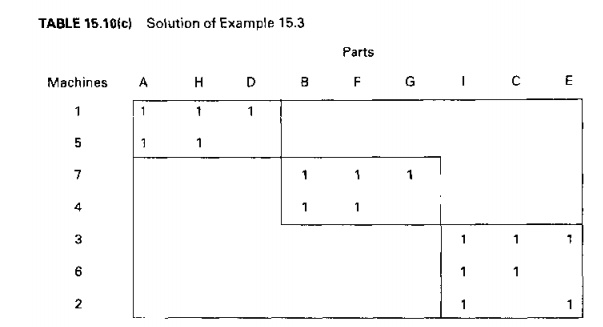
In the
example problem, it was possible to divide the parts and machines into three
mutually exclusive part-machine groups. This represents the ideal case because
the part families and associated machine cells are completely segregated.
However, it is not uncommon for there to be an overlap in processing
requirements between machine groups That is, a given part type needs to be processed
by more than one machine group. Let us illustrate this case and how the rank
order clustering technique deals with it in the following example.
EXAMPLE 15.4 Overlapping Machine Requirements
Consider the part-machine incidence matrix in Table 15.11. This is the same as the original part-machine incidence matrix in Table 15.4 except that part B requires
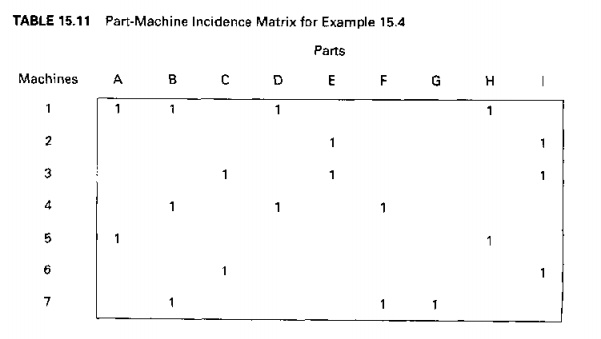
processing
on machines 1.4, and 7 (1 is the additional machine) and part D now requires
processing on machines 1 and 4 (4 is the additional machine). Use the rank
order clustering technique to arrange parts and machine into groups.
Solution: The rank order clustering technique
converges to a solution in two iterations, shown in Tables 15.12(a) and
15.l2(b), with the final solution shown in Table1.'l.12(c).
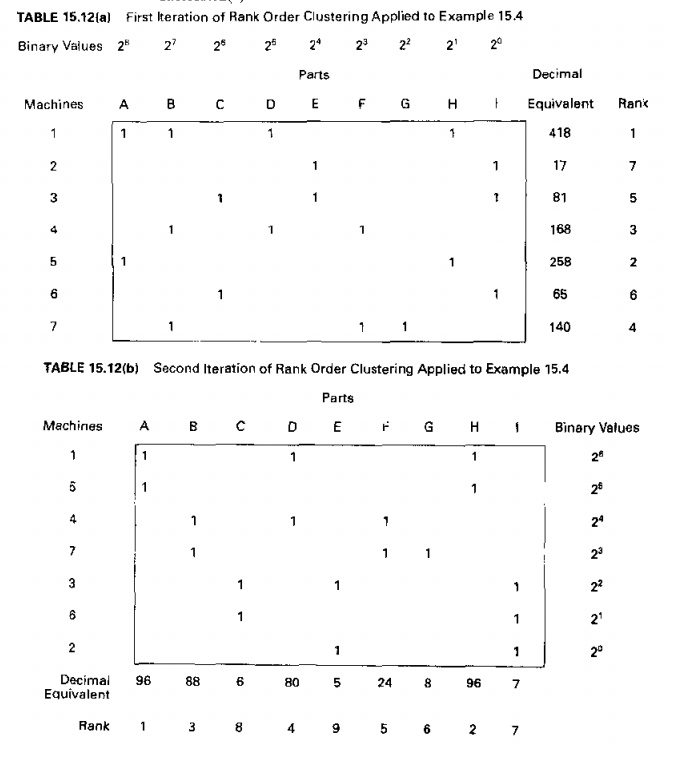
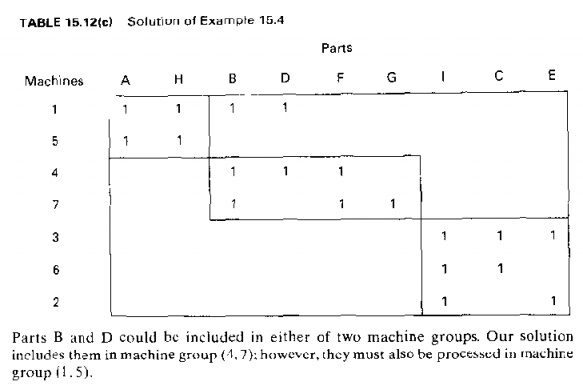
Parts B
and D could be included in either of two machine groups. Our solution includes
them in machine group (1.7); however, they must also be processed in machine
group (1. 5)
King [26]
refers to the matrix elements
Bl and Dj (parts Band D
processed on machine in Table 15.l2(c) as exceptional elements,
He recommends that they each he
replaced with an asterisk (*) and treated
as zeros when applying the rank order clustering technique. The effect
of' this approach in our
example problem would
be to organize the machines
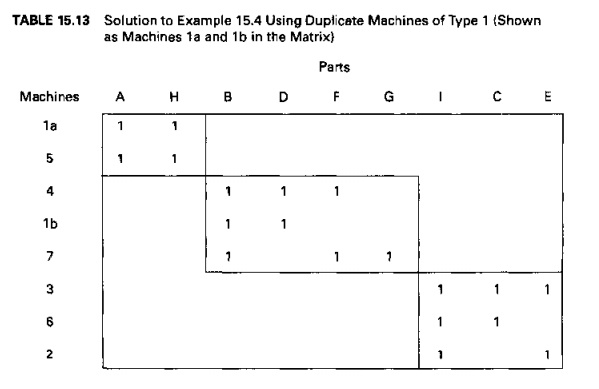
exactly as we have done in our final solution in Table 15.12(c).Another way of
dealing with the overlap h simply to duplicate the machine that is used by more
than one part family. In Example 15.4, this would mean that two machines of
type 1 would be used in the two censTbe result of this duplication is shown in
the matrix of Table 15.13.where the two machines are identified as l a and j b.
Of course. there may be economic considerations that would inhibit the machine
redundancy.
Other
approaches to the problem of overlapping machines, attributed to Burbidge [26J,
include: (1) change the routing so that all processing can be accomplished in
the pn. mary machine group. (2) redesign the part to eliminate the processing
requirement outside the primary machine group, and (3) purchase the part from
an outside supplier.
Arranging
Machines in 8 GT Cell
After
part-machine groupings have been identified by rank order clustering or other
method. the next problem is to organize the machines into the most logical
arrangement. Let us describe two simple yet effective methods suggested by Hollier
[17]. Both methods use data contained in From-To charts (Section 10.6.1) and
are intended to arrange the machines in an order that maximizes the proportion
of in-sequence moves within the cell
Hollier
Method 1. The first method uses the sums of flow "From" and
"To" each machine in the cell. The method
can be outlined as follows:
Develop
the From-To chart from part routing data. The data contained in
the chart indicates numbers of part moves between the machines (or
workstations) in the cell. Moves into and out of the cell are not included in
the chart.
Determine
the “From” and “TO” sums for each
machine. This is accomplished by summing
all of the "From" trips and "To" trips for each machine (or
operation). The "From" sum for a machine is determined by adding the entries in the
corresponding row, and the "To" sum is found by adding the entries in the
corresponding column.
Assign
machines to the cell hosed on minimum
"From" or "To" sums. The machine having the smallest sum is selected. If the minimum value is a
"To" sum, then the machine is placed at the beginning of the
sequence. If the minimum value is a "From" sum, then the machine is
placed at the end of the sequence. TIe breaker rules:
If a tie
occurs between minimum "To" sums or minimum "From" sums,
then the machine with the minimum "From/To" ratio is selected.
If both
"To" and "From" sums are equal for a selected machine,it is
passed over and the machine with the next lowest sum is selected.
If a
minimum "To" sum is equal to a minimum "From" sum, then
both machines are selected and placed at the beginning and end of the sequence,
respectively.
Reformat the From-To chan. After
each machine has been selected, restructure the From-To chart by
eliminating the row and column corresponding to the selected machine and recalculate the
"From" and "To" sums. Repeat steps 3 and 4 until all
machines have been assigned.
EXAMPLE 15.5 Group
Technology Machine Sequence using
Hollier Method 1
Suppose
that four machines. I, 2.3, and 4 have been identified as belonging in a GT
machine cell. An analysis of 50 parts processed on these machines has been
summarized in the From-To chart of Table 15.14. Additional information is that
'50 parts enter the machine grouping at machine 3,20 parts leave after
processing at machine 1, and 30 parts leave after machine 4. Determine a
logical machine arrangement using Hollier Method 1.
Solution: Summing the From trips and To
trips for each machine yields the "From" and "To" sums in
Table 15.15(a). The minimum sum value is the "To" sum for machine 3.
Machine 3 is therefore placed at the beginning of the sequence. Eliminating the
row and column corresponding to machine 3 yields the revised From-To chart in
Table 15.15(b). The minimum sum in this chart is the "To"
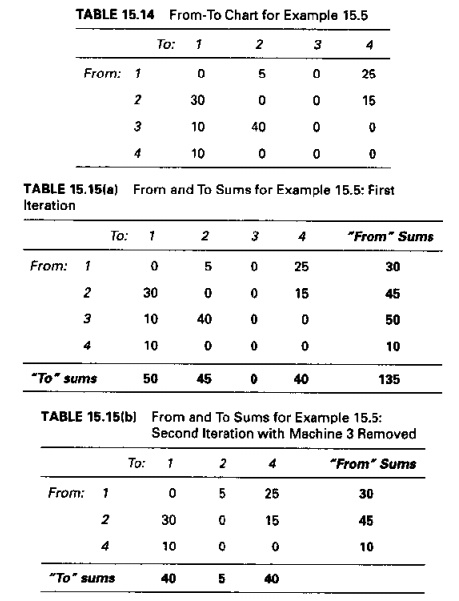
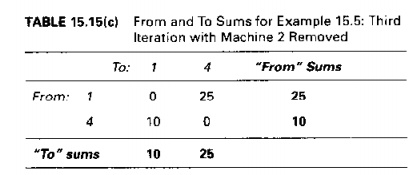
sum
corresponding to machine 2. which is placed at the front at the sequence,
immediately following machine 3. Eliminating machine 2 produces the revised From-To chart in Table 15.15(c).
The minimum sum in this chart is the "To" sum for machine I. Machine
I is placed after machine 2 and finally machine 4 is placed at the end of the
sequence. Thus, the resulting machine sequence is
3-- > 2 -- > 1 -- > 4
Hollier
Method 2. This approach is based on the use of From/To ratios formed by summing
the total flow from and to each machine in the cell. The method can he reduced
to three steps:
Develop the From-To
chart. This is the same step as in Hollier Method
1.
Determine
the From/To ratio for each machine. This i~ accomplished by summing up all of the "From" trips
and "To" trips for each machine (or operation). The "From"
sum for a machine is determined by adding the entries in the corresponding row,
and the "To" sum is determined by adding the entries in the
corresponding column. For each machine, the From/To ratio is calculated by
taking the "From" sum for each machine and dividing by the respective
"To" sum.
Arrange
machines in order of decreasing From/To ratio. Machines
with II high From/To ratio distribute work to many
machines in the cell but receive work from few machines. Conversely, machines
with a low From/To ratio receive more work than they distribute. Therefore,
machines are arranged in order of descending Prom/Io ratio. That is, machines
with high ratios are placed at the beginning of the work flow, and machine,
with low ratios are placed at the end of the work flow. in case of a tie, the
machine with the higher "From" value is placed ahead of the machine
with a lower value
EXAMPLE 15.6
Group Technology Machine Sequence using
Hollier Method 2
Solve
Example 15.5 using Hollier Method 2.
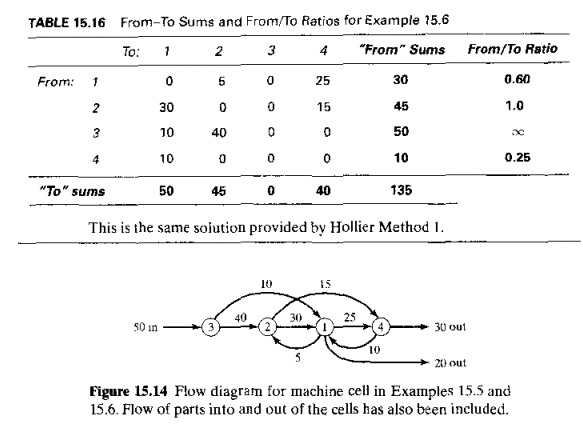
Solution: Table 15.15(a), containing the
"From" and "To" sums, is repeated in Table 15.16, along with the From/To ratios given in
the last column on the right. Arranging the machines III order of descending Prom/To
ratio, the machines in the cell should he sequenced as follows'
3 -- > 2 -- > 1 -- > 4
It is
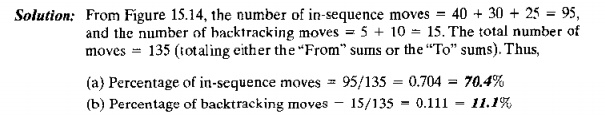
helpful to use one of the available graphical techniques, such as the flow
diagram (Section 10.6.1), to conceptualize the work flow in the cell. The flow
diagram for the machine arrangement in Examples 15.5 and 15.6 is presented in
Figure 15,14. The work flow is mostly inline; however, there is some back flow
or parts that must be considered in the design of any material handling system
that might be used in the cell. A powered convey or would be appropriate for
the forward flow between machines. with
manual handling for the back flow.
For our
example data in Table 1'1.14, Hollier Methods 1 and 2 provide the same
solution. This is not always the case. The relative performance of the two
methods depends on the given problem. In some problems. Method J will
outperform Method 2.and in other problems the opposite will happen. In many
problems, the two methods yield identical solutions, as in Examples 15.5 and
15.0. Hollier presents a comparison of these and his other proposed methods
with a variety of problems in [17].
Two
performance measures can be defined to compare solutions to the machine sequencing problem: (1)
percentage of in-sequence moves and (2) percentage of backtracking moves. The percentage of in-sequence moves is
computed by adding
all of the values representing in-sequence moves and dividing by the total
number of moves. The percentage of
backtracking moves is determined by summing all of the values representing
backtracking moves and dividing by the total number of moves.
EXAMPLE 15.7 Performance Measures for
Alternative Machine Sequence ••in GT cell
Compute
(a) the percentage of in-sequence moves and (b) the percentage of backtracking
moves for the solution in Examples 15.5 and 15.6.
Related Topics