Chapter: Engineering Economics and Financial Accounting : Demand and Supply Analysis
Important Questions and Answers: Demand and Supply Analysis
DEMAND AND SUPPLY ANALYSIS
1.Define Demand.
Demand
indicates the quantities of products (goods service) which the firm is willing
and financially able to purchase at various prices, holding other factors
constant.
2. Define Determinants of Demand:
An
individual’s demand for a commodity depends on his desire and capability to
purchase it. Apart from the desire to purchase, there are many other factors
which influence the purchase of a product (demand). These are known as demand
determinants.
3. What is meant by Tastes and preferences of
Consumers:
The
change of tastes and preferences of consumers in favor of a commodity will
result in a greater demand for the commodity. The opposite also holds good i.e.
if the tastes and preferences of consumer change against the commodity, the
demand will suffer.
4. What are the two kinds of Consumers
expectations?
Consumers
have two kind of expectations one pertains to their future income and the
second is related to the future prices of the goods and its related goods.
5. Define Advertising
Advertisements
provide information about the presence of quality products in the market and
induces customer’s to buy more. It also promotes the latest preferences of the
general public to masses.
6. Define the Law of Demand:
The
relation of price to quantity demanded / sales is known as the law of demand.
Law of demand states that the higher the price is the lower the demand is and
vice versa, holding other factors as constant.
7. Define the price quantity relation.
This
price quantity relation can be expressed as demand being a function of price
D=f(p).
8. What Highlights of the law of demand:
1. The
relationship between price and quantity demanded is inverse.
2. Price is
the independent variable and demand the dependent variable.
3. Law of
demand assumes that except for price and demand, other factors remain constant.
9. What is Demand Shift: (Change in demand)
Factors shift the demand for a particular product
either on the right side of the demand curve or to the left side of the demand
curve based on the changes in price. These factors, other than the price of a
good that influence demand are known as demand shifters. The shift in the
demand either to the left or right is called the demand shift.
10.What are
the Exceptions to law of demand:
1. In share
markets on would have noticed that the rise in price of the shares increases,
the sales of the shares while decrease in the price of the shares results in
decrease of sale of the shares.
2. Some
goods which act as status symbol and have a snob appeal fall under this
category. Here when the price of the product rises then the appeal of the
product also rises and thus the demand. Some example are diamonds and antiques.
3. Finally,
ignorance on the part of the consumer may cause the consumer to buy at a higher
price, especially when the rise in price is taken to mean an improvement in
quality and a reduction in price as deterioration in quality.
11.Define Individual demand :
The quantity of a product demanded by an individual
purchaser at a given price is known as individual demand.
12.Define Market demand :
The total
quantity demanded by all the purchasers together is known as the market demand.
13.What are
the types of Demand function
1. Consumption
function
2. Product
consumption function
3. Differences
in regional incomes
4. Income
expectation and demand
14.What are
the Characteristics of demand function ?
1. The long
run relationship between consumption and income is some what stable, and
expenditure on consumption is usually about 85 to 90% of the income.
2. The
consumption function is highly unstable in short runs and the relationship
between income and consumption cannot be predicted by any mathematical formula.
3. During
the periods of economic prosperity, there is an absolute increase in the
expenditure on consumption, but decrease as a percentage of income during
periods of depression, the consumption declines absolutely but the expenditure
on the consumption increases as a percentage of income.
4. In the
periods of economic recovery, the rate of increase in consumption is higher
than the rate of the decline in consumption in times of recession.
15.Define
Product consumption function:
This function can be defined as the relationship
between the total income of the consumer and sales of particular products. It
means that when there is a change in income there is a change in the demand for
particular products.
16. Define Income expectations
and Demand:
Expectations are related to people’s estimates of
the level and durability of the future economic conditions. The demand for many
consumer durables (household appliances like TV, Washing machine, etc) is often
sensitive to general expectations regarding income level.
17.What are
the features of advertising demand relationship ?
1. Even when
there is no advertising effort done, there will be a certain amount of sales
possible for a particular product by virtue of its presence in the market.
2. There is
a direct relationship between advertising and sales. Thus when there is an
increased spending on advertisements. It will bring in more sales.
3. Increase
in advertisements will lead to more than proportionate increase in sales only
to a point. After that any increase in advertisement will have only less than
proportionate effect on sales.
18.Define
Elasticity of Demand:
Elasticity of demand is defined as ‘the percentage
change in quantity demanded caused by one percent change in the demand
determinant under consideration, while other determinants are held constant’.
19. Define demand determinant
It is the
degree of change in demand to the degree of change in any of the demand
determinants.
20.What are the Various
Elasticities ?
1. Price
elasticity of demand
2. Income
elasticity of demand
3. Cross
elasticity of demand
4. Promotional
elasticity
5. Exportations
elasticity of demand
21.Define
Price Elasticity of Demand
Price elasticity of demand can be defined as “the
degree of responsiveness of quantity demanded to a change in price”.
22.What are
the Types of price elasticity:
1. Perfectly
elastic demand
2. Absolutely
inclastic demand or perfectly inelastic demand
3. Unit
elasticity of demand
4. Relatively
elastic demand
5. Relatively
inelastic demand
23.Define Absolutely inelastic demand or perfectly
inelastic demand (ep=):
Absolutely
inelastic demand is where a change in price howsoever large, causes no change
in the quantity demanded of a product. Here, the shape of the demand curve is
vertical.
24.Define Relatively elastic demand (ep>1):
It is
where a reduction in price leads to more than proportionate change in demand.
Here the shape of the demand curve in flat.
25.What are theFactors determining price elasticity
of Demand ?
The
elasticity of demand depends on the following factors namely
1. Nature of
the product
2. Extent of
usage
3. Availability
of substitutes
4. Income
level of people
5. Proportion
of the income spent of the product
6. Urgency
of demand and
7. Durability
of a product.
Part B
1.
i. Define
law of demand &explain the types of demand.
According
to Marshall, The amount demanded increases with a fall in price and diminishes
with a rice in price, other remaining constant.
Types of Demand
ü Individual
& Market demand
ü Firm and
Industry product
ü Autonomous
& Derived demand
ü Demand
for durable and non durable demand
ü Short
term and long term demand
ü Joint
demand and composite demand
ü Direct
demand and Indirect demand
ü Total
market and Market segment demand
ü Negative
demand
ii.Why does demand curve sloping Downwards ?
Ø substitution effect
Ø income
effect
Ø new
consumer creating demand
Ø price
effect
Ø different
uses
2. Write a note on elasticity of supply & it’s
types
It is a
measure of degree of responsiveness of supply to the change in price
E(s) =
Proportional change in supply / Proportional change in price
Types of Elasticity of supply
1.Completely
(Perfectly) Inelastic supply: In this case the quantity
supplied does not react to the changes in the price. The increase or decrease
in the price does not change the quantity supplied.

2.Completely
(Perfectly) Elastic supply: When a minuscule change in
price results in infinite change in the quantity supplied then it is a case
of completely elastic supply. For instance when there is marginal rise in the
price, then the quantity supplied rises infinitely.
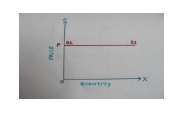
Unitary
Elastic supply: When the proportionate change in quantity supplied
is equal to the proportionate change in the price of the
commodity then we call it as unitary or unit elasticity of supply.
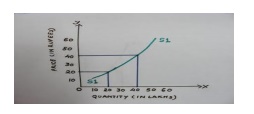
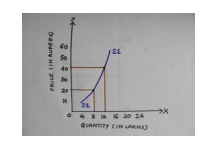
4.Relatively
Inelastic supply: When the percentage change in quantity supplied
is less than the proportionate change in price than it is a case
of relatively inelastic supply.
3. .Briefly
explain about various factors determining the demand.
ü Price of
the commodity
ü Taste
& Preference
ü Advertisements
& Sales Propaganda
ü Growth of
Population
ü Tax rate
ü Pattern
of saving Income of the consumer
ü Price of
related goods
ü Consumer’s
Expectations
ü Weather
conditions
ü Availability
of credit
ü Circulation
of money
4.
Describe
concept of demand elasticity .
It
denotes a measure of the rate at which demand changes in response to the change
in prices
1. Price
Elasticity of demand
2. Income
Elasticity of demand
3. Cross
elasticity of demand
4. Promotional
elasticity of demand 1.Price Elasticity of demand
Perfectly
Elastic demand ( E=∞)Demand change but price does not change
Perfectly
Inelastic demand ( E=0)
If the
demand for a commodity does not change in spite of an increase or decrease in
its price
Unitary
Elastic demand ( E=1)
Change in
demand is exactly proportionate to the change in price
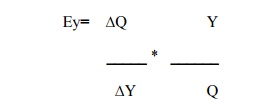
2.Income
Elasticity of Demand
It is defined as the percentage change in the
quantity demanded of a good divided by the percentage change in the income of
the consumer,
3.Cross
elasticity of demand
A change
in demand for one good in response to a change in the price of another good .
It is a
measure of the responsiveness of demand for a commodity to the change in outlay
on advertisements and other promotional efforts
5. Discuss in detail about the Measurement of
Price Elasticity of Demand
1. Percentage Method
It
measures the percentage change in the quantity of a commodity demanded
resulting from a given percentage change in its price

2. Point Method or Geometric Method
It
measures the elasticity of demand on different points of a demand curve. It is
a variant proportionate method.

3. Arc Method
segment
of a demand curve between two points is called Arc.

Where
∆Q=
change in quantity demanded
∆P=
Change in price of the commodity
P1=
Original price
P2=New
Price
Q1=Original
quantity
Q2=New
quantity
4. Total outlay Method
It is
measured on the basis of change in total outlay or total expenditure in
response to change in the price of the commodity
Types:
Unitary Elasticity: Small
changes in price unaffected the total outlay
Elastic demand: Small changes in price increases
the total outlay
Inelastic demand: Small
changes in price decreases the total outlay
5. Revenue Method
It refers
to the sale proceeds of a firm

Where,
Ep=Stands for elasticity of demand
A=Stands for average revenue
M=Stands for Marginal
revenue
2.Income Elasticity of Demand
It is
defined as the percentage change in the quantity demanded of a good divided by
the percentage change in the income of the consumer,

Where,
Ey=
stands for income elasticity
Q=stands
for quantity demanded
Y=stands
for income
∆Q= Gives change in quantity demanded
∆Y = Gives change in income
Types of Income Elasticity of
demand
1.High Income elasticity : If Income
increases in high and quantity demand also good increases
2. Unitary Income elasticity: Changes
in income and quantity demanded are same
3. Low Income elasticity: If Income
increases in low and quantity demand also good increases
4. 4.Zero Income elasticity: No change
in quantity demanded by the changes in income
5. 5.Negative Income elasticity: Increase
in income results in decreases in quantity demanded
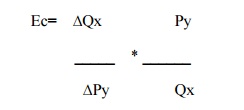
3. Cross elasticity of demand
A change
in demand for one good in response to a change in the price of another good .
Where,

Ec=stands
for cross elaticity
∆Qx=
changes in quantity demanded
Py=original
price of good y
∆Py=small changes in price of y
Qx=changes in
quantity demanded
Applications of cross elasticity
in management
a. In Production
b. Demand forecasting and pricing
c. In international trade and balance of payments
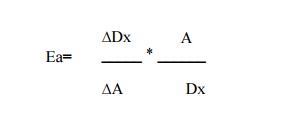
4. Advertising and promotional elasticity of demand
It is a
measure of the responsiveness of demand for a commodity to the change in outlay
on advertisements and
other
promotional efforts

Factors determining advertising
elasticity of demand
ü Type of
commodity
ü Market
share
ü Rival’s
reactions
ü State of
economy
ü Effect of advertising in terms of time
6.Tools of Forecasting Techniques
1. Qualitative model
a. Delphi
Technique
A
systematic forecasting method that involves structured interaction among a
group of experts on a subject.
The
Delphi Technique typically includes at least two rounds of experts answering
questions and giving justification for their answers, providing the opportunity
between rounds for changes and revisions.
b. Nominal group technique
The
nominal group technique (NGT) is a group process involving problem
identification, solution generation, and decision making.
c. Marketing research method
The
process or set of processes that links the consumers, customers, and end users
to the marketer through information — information used to identify and define
marketing opportunities and problems and improve understanding of marketing as
a process.
d. Sales force composite method
A
technique used by production managers to project the future demand for a good
or service based on the total amount that each salesperson anticipates being
able to sell in their region.
2. Quanitative model
I.Time Series Models
a. Last period Method
Uses last
period’s actual value as a forecast
Ft= At –
1
Ft =
Forecast demand for period t
At-1=
Actual demand in previous period
b. Simple Average Method
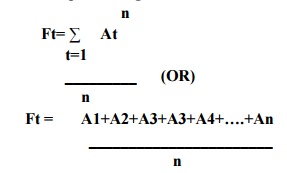
Ft
=Forecasted demand for period t
At=
Actual demand for period t
n= Total
no of periods
c. Moving average method
Uses an
average of a specified number of the most recent observations, with each observation
receiving a different emphasis (weight)

Where
Ft- Forecasted demand for period t
At- Actual demand for period t
n- Total no of periods
d. Exponential smoothing method
A
weighted average procedure with weights declining exponentially as data become
older.
Ft = Ft-1 + a(At-1 –
Ft-1)
Where
Ft – Forecasted demand for period t
Ft-1 –forecasted demand for previous method a- Smoothening constant
At-1- Actual demand for previous demand
e. Trend Project( Past data/ Predicting the future)
This
method is a version of the linear regression technique.
Y = a +
bX
Where
X
represents the values on the horizontal axis (time)
Y
represents the values on the vertical axis (demand).
2. Cause and Effect Model
a. Correlation and Regression method
Linear regression is a
mathematical technique that relates one variable, called an independent variable, to
another, the dependent variable,
Y = a +
bX
Y-
independent variable X- Dependent variable a- the intercept
B- slope
of the line
b. Econometric Method
It
includes endogenous –determined within the model ( controlled variables) and
exogenous variable-determined outside the model(uncontrolled variables)
eg.,
Money
C. Input and output method
It helps
to determine Or forecast the demand of a particular product or services.
d. End use method
It has
theoretical and practical method or value. It is influenced by the
technological , structural and other changes.
Related Topics