Chapter: Business Science : Information Management : System Analysis and Design
Decision Tables
Decision Tables
A
decision table is a good way to deal with combinations of things (e.g. inputs).
This technique is sometimes also referred to as a ‘cause-effect‘ table. The
reason for this is that there is an associated logic diagramming technique
called ‘cause-effect graphing‘ which was sometimes used to help derive the
decision table.
Decision
tables provide a systematic way of stating complex business rules, which is
useful for developers as well as for testers.
Decision
tables can be used in test design whether or not they are used in
specifications, as they help testers explore the effects of combinations of
different inputs and other software states that must correctly implement
business rules.
It helps
the developers to do a better job can also lead to better relationships with
them. Testing combinations can be a challenge, as the number of combinations
can often be huge. Testing all combinations may be impractical if not
impossible. We have to be satisfied with testing just a small subset of
combinations but making the choice of which combinations to test and which to
leave out
is also important. If you do not have a systematic way of selecting
combinations, an arbitrary subset will be used and this may well result in an
ineffective test effort.
Three
parts
Condition
rows (stubs)
Lists
condition relevant to decision
Action
rows (stubs)
Actions
that result from a given set of conditions
Rules
Specify
which actions are to be followed for a given set of conditions
Uses of
decision tables
Powerful
visualisation
Compact
and structured presentation
Preventing
errors is easier
Avoid
incompleteness and inconsistency
Modular
knowledge organisation
Group
related rules into single table
Combine
tables to achieve decision
Decision
Table Methodology
Identify Conditions & Values:
Find the
data attribute each condition tests and all of the attribute's values.
Identify Possible Actions:
Determine
each independent action to be taken for the decision or policy.
Compute Max Number of Rules:
Multiply
the number of values for each condition data attribute by each other.
Enter All Possible Rules:
Fill in
the values of the condition data attributes in each numbered rule column.
Define Actions for each Rule:
For each
rule, mark the appropriate actions with an X in the decision table.
Verify the Policy Review completed decision table
with end-users.
Simplify the Table Eliminate and/or consolidate
rules to reduce the number of columns.
Conditions Rule 1 Rule 2 Rule
3 Rule 4
Repayment
amount has been entered:
Term of
loan has been Entered:
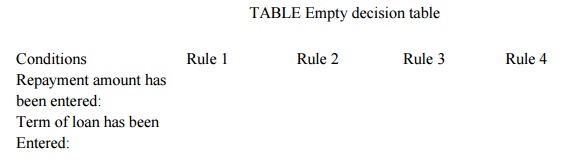
Next we
will identify all of the combinations of True and False. With two conditions,
each of which can be true or false, we will have four combinations (two to the
power of the number of things to be combined). Note that if we have three
things to combine, we will have eight combinations, with four things, there are
16, etc. This is why it is good to tackle small sets of combinations at a time.
In order to keep track of which combinations we have, we will alternate True
and False on the bottom row, put two True‘s and then two Falses on the row
above the bottom row, etc., so the top row will have all True‘s and then all
Falses (and this principle applies to all such tables).
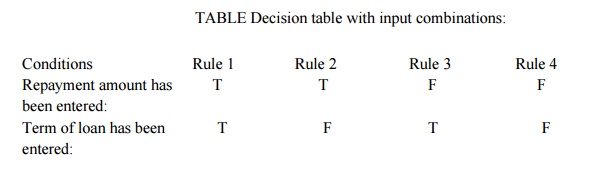
In the
next step we will now identify the correct outcome for each combination. In
this example, we can enter one or both of the two fields. Each combination is
sometimes referred to as a rule.
TABLE
Decision table with combinations and outcomes:
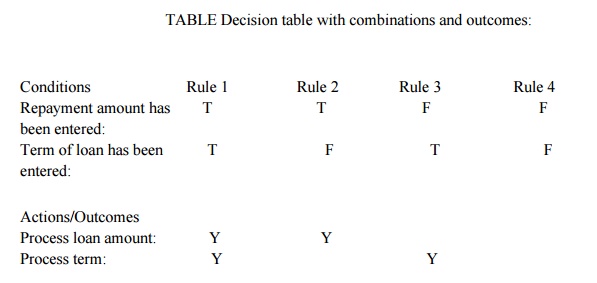
At this
point, we may realize that we hadn‘t thought about what happens if the customer
doesn‘t enter anything in either of the two fields. The table has highlighted a
combination that was not mentioned in the specification for this example. We
could assume that this combination should result in an error message, so we
need to add another action. This highlights the strength of this technique to
discover omissions and ambiguities in specifications. It is not unusual for
some combinations to be omitted from specifications; therefore this is also a
valuable technique to use when reviewing the test basis.
TABLE
Decision table with additional outcomes:
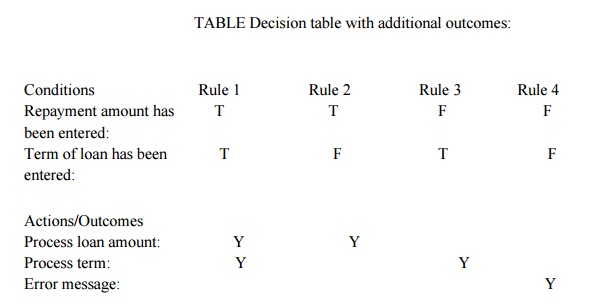
Now, we
make slight change in this example, so that the customer is not allowed to
enter both repayment and term. Now the outcome of our table will change,
because there should also be an error message if both are entered.
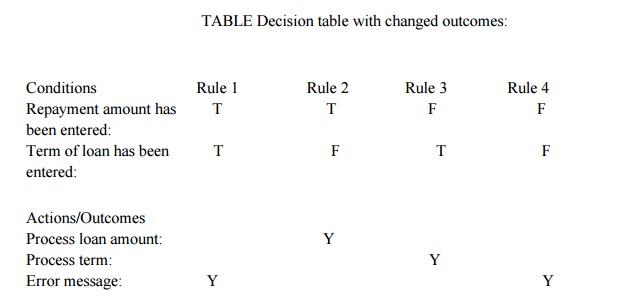
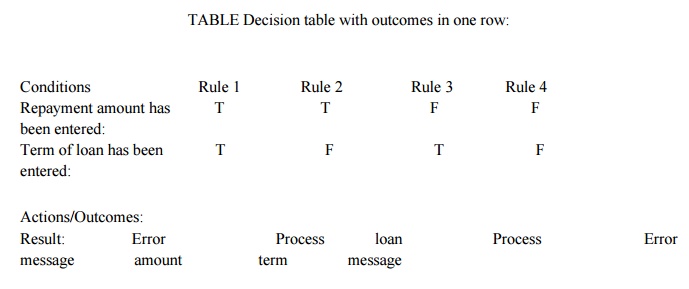
You might
notice now that there is only one ‗Yes‘ in each column, i.e. our actions are
mutually exclusive – only one action occurs for each combination of conditions.
We could represent this in a different way by listing the actions in the cell
of one row. Note that if more than one action results from any of the
combinations, then it would be better to show them as separate rows rather than
combining them into one row.
Related Topics