Chapter: Control Systems : Frequency Response Analysis
Bode plot
Bode plot
• Plots of the magnitude and phase characteristics are used to fully describe the frequency response
• A Bode plot is a (semilog) plot of the transfer function magnitude and phase angle as a function of frequency.
The gain magnitude is many times expressed in terms of decibels (dB)
db = 20 log 10 A
BODE PLOT PROCEDURE:
There are 4 basic forms in an open-loop transfer function G(jω)H(jω)
· Gain Factor K
· (jω)±p factor: pole and zero at origin
· (1+jωT)±q factor
· Quadratic factor
1+j2ζ(W / Wn)-(W2 / Wn2)
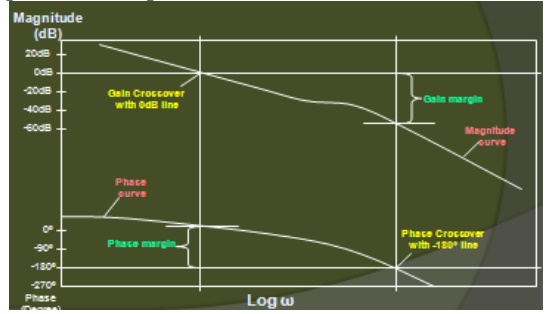
Gain margin and Phase margin Gain margin:
The gain margin is the number of dB that is below 0 dB at the phase crossover frequency (ø=-180º). It can also be increased before the closed loop system becomes unstable
Phase margin:
The phase margin is the number of degrees the phase of that is above -180º at the gain crossover frequency
Gain margin and Phase margin
Bode Plot – Example
For the following T.F draw the Bode plot and obtain Gain cross over frequency (wgc) , Phase cross over frequency , Gain Margin and Phase Margin.
G(s) = 20 / [s (1+3s) (1+4s)] Solution:
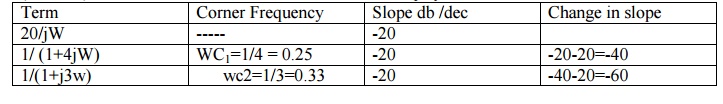
The sinusoidal T.F of G(s) is obtained by replacing s by jw in the given T.F G(jw) = 20 / [jw (1+j3w) (1+j4w)]
Corner frequencies:
wc1= 1/4 = 0.25 rad /sec ;
wc2 = 1/3 = 0.33 rad /sec
Choose a lower corner frequency and a higher Corner frequency wl= 0.025 rad/sec ;
wh = 3.3 rad / sec
Calculation of Gain (A) (MAGNITUDE PLOT)
A @ wl ; A= 20 log [ 20 / 0.025 ] = 58 .06 dB
A @ wc1 ; A = [Slope from wl to wc1 x log (wc1 / wl ] + Gain (A)@wl
= - 20 log [ 0.25 / 0.025 ] + 58.06
= 38.06 dB
A @ wc2 ; A = [Slope from wc1 to wc2 x log (wc2 / wc1 ] + Gain (A)@ wc1
= - 40 log [ 0.33 / 0.25 ] + 38
= 33 dB
A @ wh ; A = [Slope from wc2 to wh x log (wh / wc2 ] + Gain (A) @ wc2 = - 60 log [ 3.3 / 0.33 ] + 33
=-27 dB
Calculation of Phase angle for different values of frequencies [PHASE PLOT] Ø = -90O- tan -1 3w – tan -1 4w
When
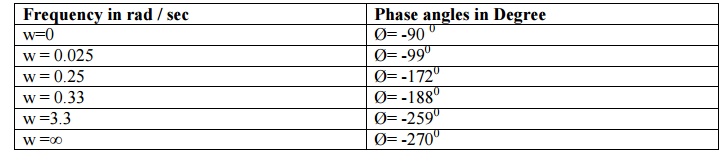
Frequency in rad / sec : Phase angles in Degree
w=0 : Ø= -90 0
w = 0.025 : Ø= -990
w = 0.25 : Ø= -1720
w = 0.33 : Ø= -1880
w =3.3 : Ø= -2590
w =∞ : Ø= -2700
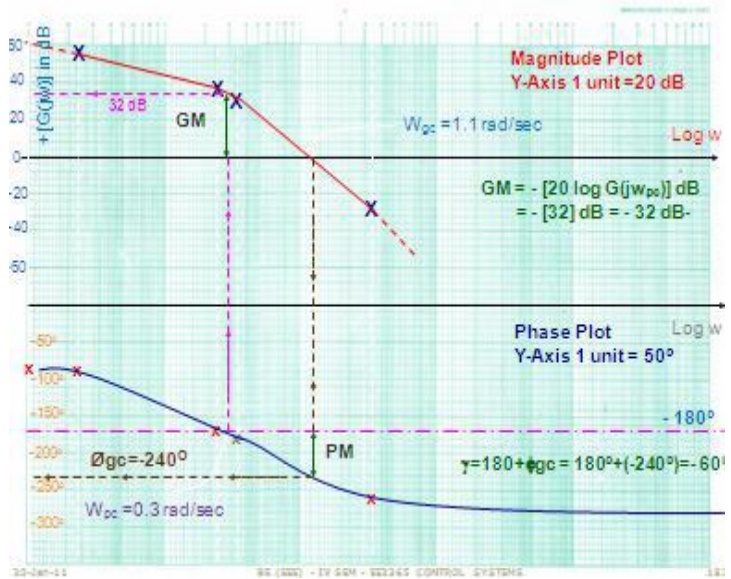
Calculations of Gain cross over frequency
The frequency at which the dB magnitude is Zero wgc = 1.1 rad / sec
Calculations of Phase cross over frequency
The frequency at which the Phase of the system is - 180o wpc = 0.3 rad / sec
Gain Margin
The gain margin in dB is given by the negative of dB magnitude of G(jw) at phase cross over frequency
GM = - { 20 log [G( jwpc )] = - { 32 } = -32 dB
Phase Margin
Ґ = 1800+ Øgc= 1800 + (- 2400o) = -600
Conclusion
For this system GM and PM are negative in values. Therefore the system is unstable in nature.
Related Topics