Exploratory Data Analysis - AD25C01
[ 3rd Semester - AIDS - Artificial Intelligence and Data Science Department ]
Under Class: | 3rd Semester [AIDS Dept Anna University 2025 Regulation] |
Exploratory Data Analysis - AD25C01 - Study Materials, Notes, Important Questions, Anna University Semester Question Paper PDF Download
Engineering - Exploratory Data Analysis - AD25C01 Subject (under Anna University 3rd Semester - AIDS - Artificial Intelligence and Data Science Department Regulation 2025) - Study Materials, Written and lecture Notes, Important Questions, Semester Question Paper PDF Download
AD25C01:
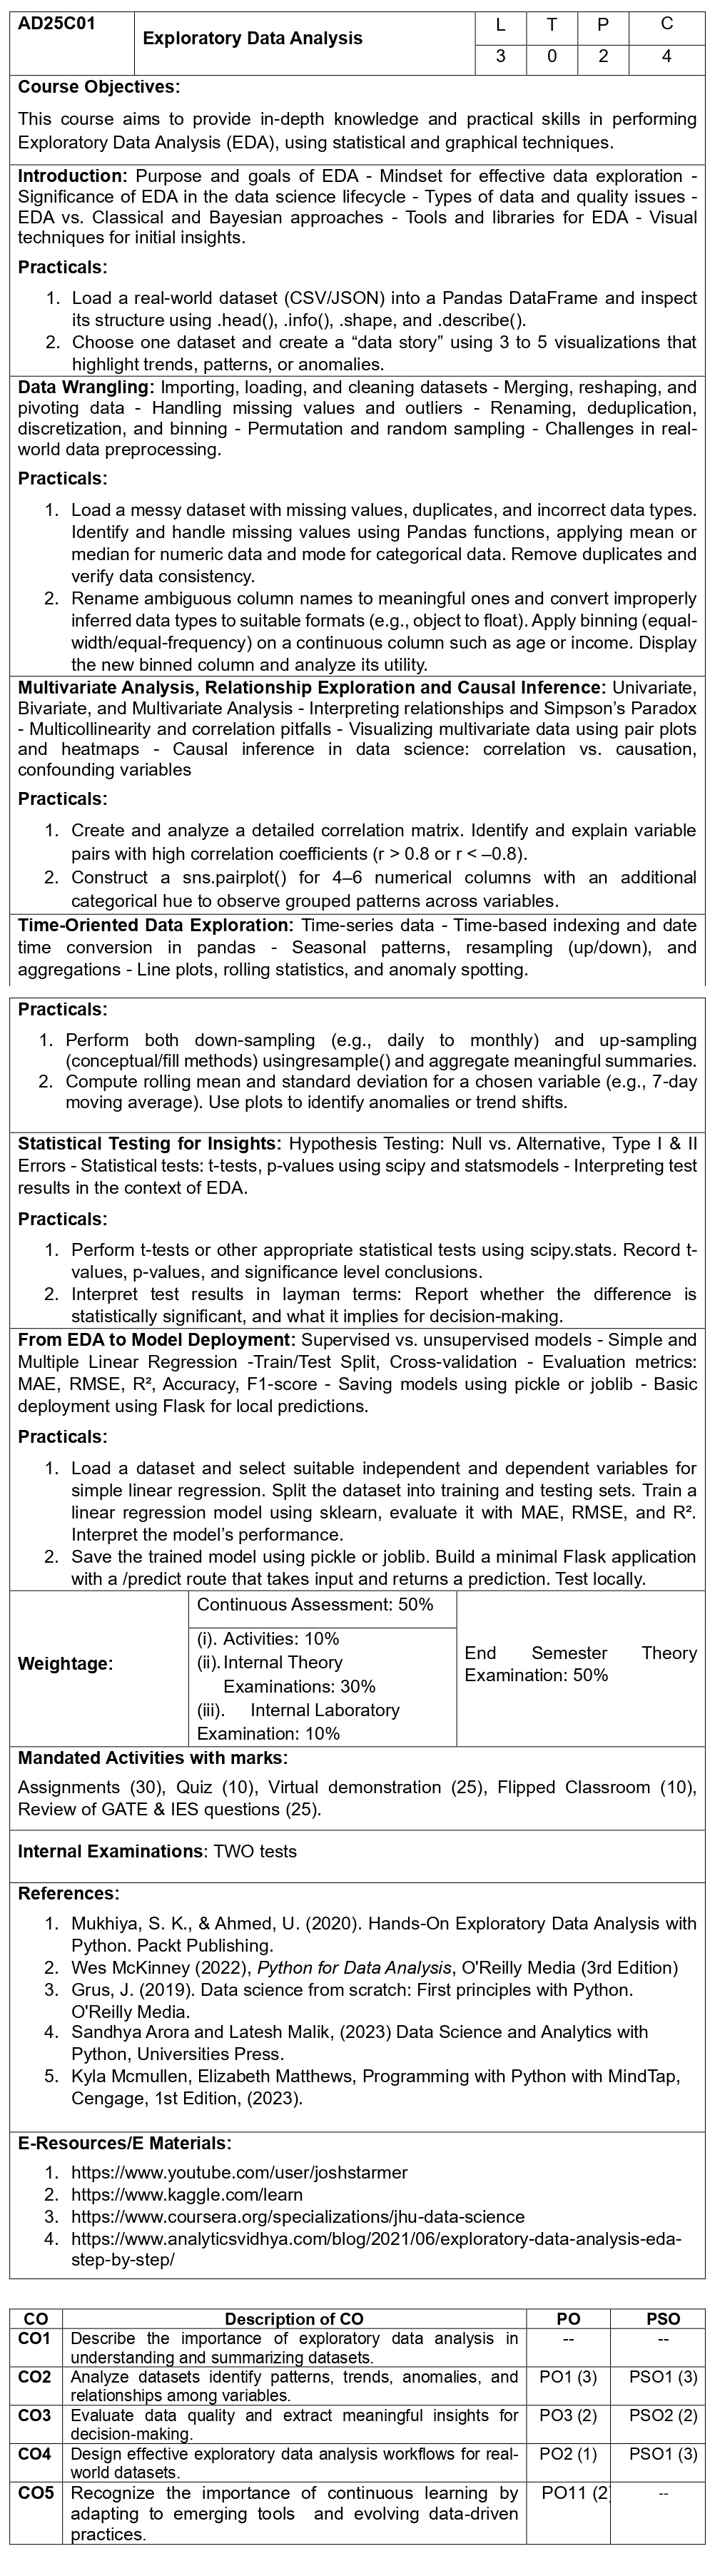
Exploratory Data Analysis
Course
Objectives:
This
course aims to provide in-depth knowledge and practical skills in performing
Exploratory Data Analysis (EDA), using statistical and graphical techniques.
Introduction:
Purpose and goals of EDA - Mindset for effective data exploration -
Significance of EDA in the data science lifecycle - Types of data and quality
issues - EDA vs. Classical and Bayesian approaches - Tools and libraries for
EDA - Visual techniques for initial insights.
Practicals:
1.
Load a real-world dataset (CSV/JSON) into a Pandas DataFrame and inspect its structure
using .head(), .info(), .shape, and .describe().
2.
Choose one dataset and create a “data story” using 3 to 5 visualizations that
highlight
trends, patterns, or anomalies.
Data
Wrangling: Importing, loading, and cleaning
datasets - Merging, reshaping, and pivoting data - Handling missing values and
outliers - Renaming, deduplication, discretization, and binning - Permutation
and random sampling - Challenges in real-world data preprocessing.
Practicals:
1.
Load a messy dataset with missing values, duplicates, and incorrect data types.
Identify and handle missing values using Pandas functions, applying mean or
median for numeric data and mode for categorical data. Remove duplicates and
verify data consistency.
2.
Rename ambiguous column names to meaningful ones and convert improperly
inferred data types to suitable formats (e.g., object to float). Apply binning
(equal-width/equal-frequency) on a continuous column such as age or income.
Display the new binned column and analyze its utility.
Multivariate Analysis, Relationship Exploration and Causal Inference: Univariate, Bivariate, and Multivariate Analysis - Interpreting relationships and Simpson’s Paradox - Multicollinearity and correlation pitfalls - Visualizing multivariate data using pair plots and heatmaps - Causal inference in data science: correlation vs. causation, confounding variables
Practicals:
1.
Create and analyze a detailed correlation matrix. Identify and explain variable
pairs with high correlation coefficients (r > 0.8 or r < –0.8).
2.
Construct a sns.pairplot() for 4–6 numerical columns with an additional categorical
hue to observe grouped patterns across variables.
Time-Oriented
Data Exploration: Time-series data - Time-based indexing
and date time conversion in pandas - Seasonal patterns, resampling (up/down),
and aggregations - Line plots, rolling statistics, and anomaly spotting.
Practicals:
1.
Perform both down-sampling (e.g., daily to monthly) and up-sampling
(conceptual/fill methods) using resample() and aggregate meaningful summaries.
2.
Compute rolling mean and standard deviation for a chosen variable (e.g., 7-day
moving average). Use plots to identify anomalies or trend shifts.
Statistical
Testing for Insights: Hypothesis Testing: Null vs.
Alternative, Type I & II Errors - Statistical tests: t-tests, p-values
using scipy and statsmodels - Interpreting test results in the context of EDA.
Practicals:
1.
Perform t-tests or other appropriate statistical tests using scipy.stats.
Record t-values, p-values, and significance level conclusions.
2.
Interpret test results in layman terms: Report whether the difference is statistically
significant, and what it implies for decision-making.
From EDA
to Model Deployment: Supervised vs. unsupervised
models - Simple and Multiple Linear Regression -Train/Test Split,
Cross-validation - Evaluation metrics: MAE, RMSE, R², Accuracy, F1-score -
Saving models using pickle or joblib - Basic deployment using Flask for local
predictions.
Practicals:
1.
Load a dataset and select suitable independent and dependent variables for
simple linear regression. Split the dataset into training and testing sets.
Train a linear regression model using sklearn, evaluate it with MAE, RMSE, and
R². Interpret the model’s performance.
2.
Save the trained model using pickle or joblib. Build a minimal Flask
application
with
a /predict route that takes input and returns a prediction. Test locally.
Weightage:
Continuous
Assessment: 50%
(i) . Activities: 10%
(ii)
. Internal Theory Examinations: 30%
(iii)
.Internal Laboratory Examination: 10%
End Semester Theory Examination: 50%
Mandated Activities with marks: Assignments (30), Quiz (10), Virtual demonstration (25), Flipped Classroom (10), Review of GATE & IES questions (25).
Internal Examinations:
TWO tests
References:
1.
Mukhiya, S. K., & Ahmed, U. (2020). Hands-On Exploratory Data Analysis with
Python. Packt Publishing.
2.
Wes McKinney (2022), Python for Data Analysis, O'Reilly Media (3rd Edition)
3.
Grus, J. (2019). Data science from scratch: First principles with Python.
O'Reilly Media.
4.
Sandhya Arora and Latesh Malik, (2023) Data Science and Analytics with Python,
Universities Press.
5.
Kyla Mcmullen, Elizabeth Matthews, Programming with Python with MindTap,
Cengage, 1st Edition, (2023).