Chapter: 11th Physics : UNIT 8 : Heat and Thermodynamics
PV diagram - Internal Energy (U)
PV diagram
PV diagram is a graph between pressure P and volume V of the system. The P-V diagram is used to calculate the amount of work done by the gas during expansion or on the gas during compression. In Unit 2, we have seen that the area under the curve will give integration of the function from lower limit to upper limit. The area under the PV diagram will give the work done during expansion or compression which is shown in Figure 8.22
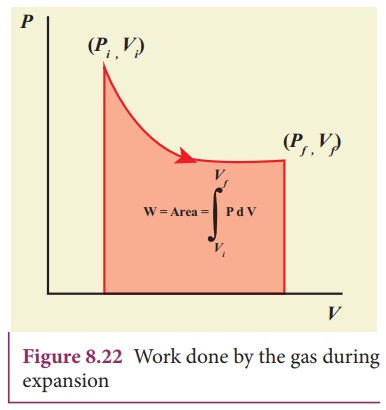
The shape of PV diagram depends on the nature of the thermodynamic process.
EXAMPLE 8.15
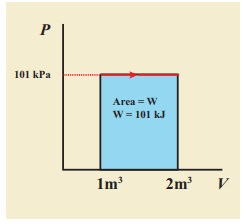
A gas expands from volume 1m3 to 2m3 at constant atmospheric pressure.
(a) Calculate the work done by the gas.
(b) Represent the work done in PV diagram.
Solution
(a) The pressure P = 1 atm = 101 kPa, Vf =2 m3 and V1 = 1m3
From equation (8.17) W =
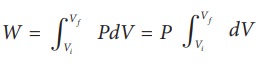
Since P is constant. It is taken out of the integral.
W = P (Vf – Vi) = 101×103 × (2 – 1) = 101 kJ
(b) Since the pressure is kept constant, PV diagram is straight line as shown in the figure. The area is equal to work done by the gas.
Note the arrow mark in the curve. Suppose the work is done on the system, then volume will decreases and the arrow will point in the opposite direction.
Related Topics