Chapter: Introduction to Human Nutrition: Food Composition
Nutrients, nonnutrients and energy
Nutrients, nonnutrients and energy
Analytical methods
Judgment should be made on the availability of suit-able methods of analyses for nutrients and whether the resources, laboratory equipment, and experience are adequate before deciding which nutrients should be included in a nutrient database. If the methods available are not well developed, one should recon-sider the importance of the nutrient and whether it justifies using limited resources, in most instances and countries, to develop the method and train the staff accordingly. It will not be cost-effective to analyze food for a particular nutrient, however high in prior-ity, if methods yield conflicting values. This implies that, as new or improved methods for measuring a nutrient emerge, foods that are important in the food supply and are known or suspected to be a good source of that nutrient should be analyzed or re-analyzed. Food regulation sometimes limits the choice of methods.
The choice of method selected should be that which most closely reflects the nutritive content of the food-stuff analyzed. A basic understanding of the chemistry of the nutrients, the nature of the food substrate (the way in which the nutrient is distributed and held in the food matrix) to be analyzed, the effect of processing and preparation on both the food matrix and the nutrient, and the expected range of concen-tration of the nutrient determine the choice of method. An understanding of the role of the nutrient in the diet of individuals or populations is also a prerequisite.
The basic principle is that the method used should provide information that is nutritionally appropriate. For instance, traditionally, carbohydrate was esti-mated by difference, that is, by directly measuring the percentage of protein (from the nitrogen content), fat, ash, and water, and deducting these from 100 to provide the percentage of carbohydrate. This method is inadequate for all nutritional purposes as it com-bines in one value all of the different carbohydrate species: sugars, oligosaccharides, and polysaccharides (starch and non-starch), together with all of the errors in the other determinations, as the physiological effects of all of the components are quite different. Therefore, the sum of the individually analyzed car-bohydrates is widely recommended today.
In studying the relationship between particular foods and health or disease, the biological action of related nutrients may be crucial information for par-ticular uses of food composition data. For example, a study on the role of vitamin A and carotenoids in lung cancer requires more information than the vitamin A activity expressed in retinol equivalents. At the very least, vitamin A and provitamin A activity are required separately. Information on provitamin A could be divided into the various provitamin A carotenoids, and it may also be desirable to have information on other carotenoids present. This is also true for the vitamers of other vitamins, including vitamin B6 (pyridoxal, pyridoxal phosphate, and pyridoxamine), folic acid (with a side-chain with one, three, or seven glutamic acid residues), vitamin D (D2 or D3), vitamin E (various tocopherols and tocotrienols) and vitamin K (with various numbers of saturated and unsatu-rated isoprene units in the side-chain).
The EuroFIR BASIS bioactives database includes critically assessed composition data on the bioactives present in edible plants and plant-based foods as well as compilation of critically assessed data on their biological effect (http://www.eurofir.net).
Criteria for inclusion in tables
As the number of nutrients is reasonably infinite, it is to some extent easier to choose and prioritize food items. Core nutrients for a nutritional database include the major proximate constituents, those that are essen-tial, and those for which there are recommended intakes. The inclusion of micronutrients, especially trace elements, fatty acid profiles, amino acid compo-sition and the various forms of vitamins is normally limited by the resources available. Many databases give limited coverage of the carbohydrates and carotenoids in foods, but methods are available and this limitation will probably disappear in the future.
Nutrients to be included in the food composition table will depend on the proposed use of the table. For instance, when assessing nutrient intake, two types of nutrients can often be distinguished: those nutrients that are found in small quantities in a large number of foods, such as iron and most of the B vitamins, and those that are found in large quantities in a small number of foods, such as cholesterol and vitamin A. The FAO limits the inclusion of nutrients in the table for group feeding schemes to 11 nutrients per 100 g of edible portion. The nutrients that have been selected as the most important for developing countries are energy, protein, fat, calcium, iron, vitamin A, thiamine, riboflavin, niacin, folate, and vitamin C.
Complete coverage of all nutrients in a single food database is unlikely, as priorities are set according to the importance of a food in the provision of a nutri-ent, resulting normally in analyses of proximates and major nutrients. However, with the growing interest in the role of biologically active compounds, residues, and toxicants in food there is increased pressure to include these in special-purpose food composition tables. Phytochemicals or phytoprotectants, often used in functional foods, are bioactive compounds found in food that may have benefits to human health.
A provisional database for food flavonoid compo-sition has been developed and is maintained by the United States Department of Agriculture (USDA) on its National Nutrient Databank website (http://www. ars.usda.gov/nutrientdata). The database contains values for 385 food items for five subclasses of flavo-noids namely flavonols, flavones, flavanones, flavan-3-ols, and anthocyanidins.
A European network established to compile and evaluate data on natural food plant toxicants, the EU AIR Concerted Action NETTOX, has previously iden-tified 31 major compound classes called the NETTOX: a list of toxicant classes with 307 major food plants listed in Europe. This list, now known as the EuroFIR NETTOX plant list (http://www.eurofir.net) has recently been published after being updated to include additional plant parts. The list now includes 550 beneficial biological effect outputs of the bioactive compounds of 328 edible plants. This list facilitates calculations of exposure to bioactive compounds such as flavanols, phenolic compounds, phytosterols, carotenoids, isoflavones, and lignans.
For a food composition database to include all these substances will imply that there may be an over-emphasis on “nonnutrients.” In general, levels of pes-ticides, residues, toxicants, and additives in food, with the exception of those that contribute to energy and nutrients, are often not reported in food composition tables.
Modes of expression
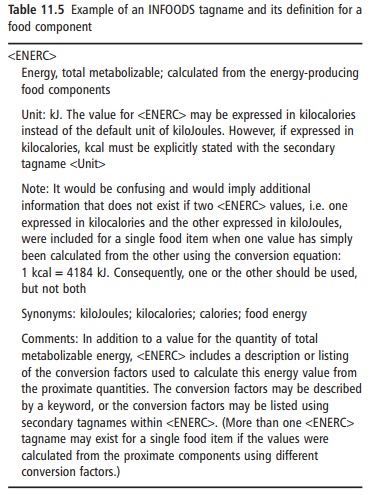
An increasing amount of attention is being paid to how data are presented in food composition tables. Interchange and compatibility of food composition databases are only possible if the data are uniformly expressed. To overcome ambiguities in the naming of nutrients and also to allow for the transfer of data among food composition tables, INFOODS has developed a system for identifying food components, referred to as tags. The term “tag” refers to the signifi-cant part of a generic identifier. Generic identifiers are predefined word-like strings of characters used to dis-tinguish one element type from another. An example of a tagname and its definition is presented in Table 11.5. The latest information on this system is available on the World Wide Web via the INFOODS home page (http://www.fao.org/infoods). As already mentioned, LanguaL is a multilingual system that provides a stan-dardized language for describing food products using faceted classification. Each food is described by a set of standard, controlled terms chosen from facets characteristic of the nutritional and/or hygienic quality of a food, for example the biological origin, method of cooking and conservation, and techno-logical treatments.
Other problems related to the method of expres-sion of nutrients may arise from the long-standing convention of using protein values derived by apply-ing a factor to measured total nitrogen values and from the calculation of energy values using energy conversion factors. Calculation of total carbohydrate content by difference as opposed to the sum of the individual carbohydrates is no longer the norm. The bases of expression in databases are the most com-monly used units (such as g) per 100 g of edible portion. In some instances unit per 100 g of dry mass is presented, or unit per 100 ml. However, some tables list nutrient content per serving size or household measure, either as purchased or as prepared.
Quality of data
The quality of food composition data is critical for the accuracy of the estimates of compounds in food. In particular, analytical data obtained from scientific literature and laboratory reports can be evaluated for quality. The quality of the analytical data is affected by various factors, including how the food samples were selected (sampling plan) and handled before analysis, use of appropriate analytical method and analytical quality control, and adequacy of number of samples to address variability. In addition, complete food description and identification of the components analyzed are also important.
The data quality evaluation system developed by the USDA is based on the evaluation of five catego-ries: sampling plan, sample handling, analytical method, analytical quality control, and the number of individual samples analyzed. Detailed documentation of all the steps within each category is important for evaluating that category. Each category gets a maximum rating of 20 rating points. A quality index (QI) is generated by combining points of all the five categories and confidence codes (CCs) ranging from A to D indicating relative confidence in the data quality are assigned. These confidence codes could be released with the data and thus provide an indication of the data quality to the user of the data. Confidence code “A” indicates data of highest quality, while con-fidence code “D” suggests data of questionable quality. These procedures can be used to guide the planning and conducting of food analysis projects.
Related Topics