Chapter: Modern Analytical Chemistry: Electrochemical Methods of Analysis
Voltammetric Techniques
Voltammetric Techniques
A number of voltammetric experiments are routinely
used in quantitative and qualitative analyses. Several of these methods are briefly described in this section.
Polarography
The earliest voltammetric experiment was normal polarography at a dropping mercury electrode. In normal polarography the potential is linearly scanned, producing voltammograms such as that shown in Figure 11.35. Although polarography takes place in an unstirred solution, a limiting current is obtained because the falling Hg drops mix the solution. Each new Hg drop, therefore, grows in a solution whose composition is identical to that of the initial bulk solution.
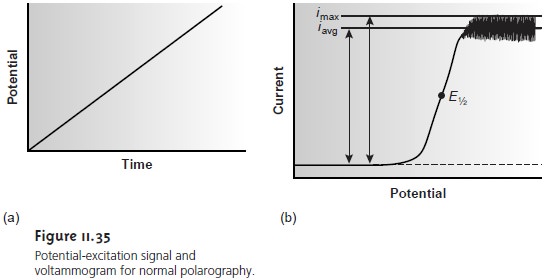
Oscillations in the current are due to the growth of the Hg drop, which leads to a time-dependent change in the area of the working electrode. The limiting current, which is also called
the diffusion current, may be measured from the maximum current, imax, or from the
average current, iavg. The
relationship between the
con- centration of analyte, CA, and
the limiting current
is given by the Ilikovic equation
(ilim)max = 706nD1/2m2/3t1/6CA
(ilim)avg = 607nD1/2m2/3t1/6CA
where
n is the number of electrons transferred in the redox reaction, D is
the analyte’s diffusion coefficient, m is the flow rate of the Hg, and t is the drop time. The half-wave potential, E1/2, provides
qualitative information about
the redox reaction (see Appendix 3E for a list of selected polarographic half-wave potentials).
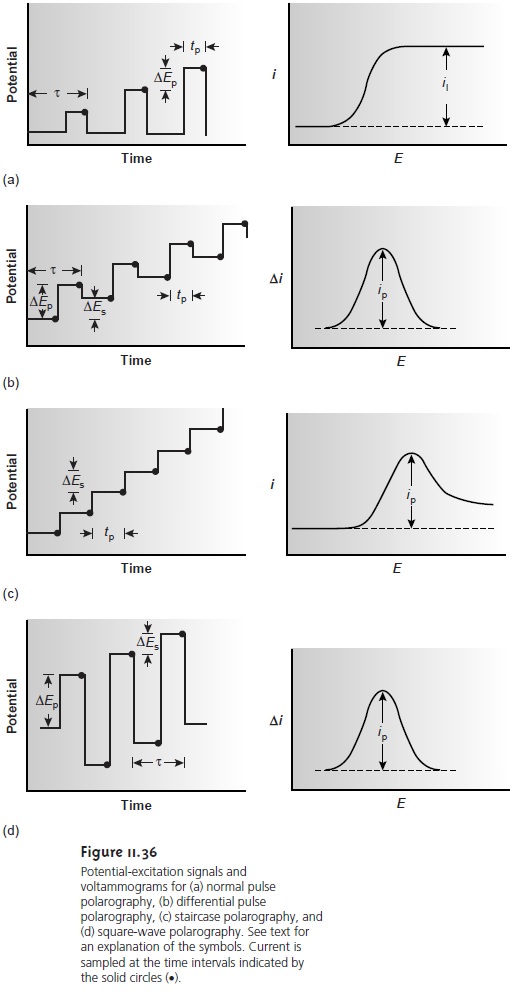
Normal polarography has been replaced by various forms of pulse polarogra- phy, several examples
of which are shown in Figure 11.36. Differential pulse po-
larography (Figure 11.36b),
for example, uses a series
of potential pulses
character- ized by a cycle of time τ, a pulse
time of tp, a potential pulse
of ∆Ep, and a potential
step per cycle of ∆Es. Typical
experimental conditions for differential pulse po-
larography are τ = 1 s, tp= 50 ms, ∆Ep = 50 mV, ∆Es = 2 mV. The current
is mea- sured twice,
for approximately 17 ms before
the forward pulse
and for approxi- mately 17 ms before
the reverse pulse.
The difference in the two currents gives
rise to a peak-shaped voltammogram. Other forms
of pulse polarography include nor- mal
pulse polarography (Figure 11.36a), staircase polarography (Figure 11.36c), and square-wave polarography (Figure 11.36d).
Limiting and peak currents are di-
rectly proportional to the concentration of analyte, and half-wave and peak poten- tials can be used for qualitative purposes. The popularity of pulse polarography is due to a substantial improvement in sensitivity and detection limits from those in
normal polarography.
|
3 3 |
Hydrodynamic Voltammetry
In
polarography a limiting
current is obtained
be- cause each falling
drop of mercury
returns the solution
near the electrode to its ini- tial composition. As noted
earlier, a limiting
current is also obtained whenever
the solution is stirred
during the analysis. The simplest means
of stirring the solution is with
a magnetic stir bar. More commonly, however,
stirring is achieved
by rotating the electrode.
In hydrodynamic voltammetry current is measured
as a function of the po-
tential applied to a solid
working electrode. The
same potential profiles used for polarography, such
as a linear scan or a differential pulse, are used
in hydrody- namic voltammetry. The resulting voltammograms are identical to those for po-
larography, except for the lack of current
oscillations resulting from the growth
of the mercury drops.
Because hydrodynamic voltammetry is not limited
to Hg elec- trodes, it is useful for the analysis
of analytes that are reduced
or oxidized at more
positive potentials.
Stripping Voltammetry
One of the most important quantitative voltammetric techniques is stripping voltammetry, which is composed of three related tech- niques: anodic, cathodic, and adsorptive stripping voltammetry. Since anodic stripping voltammetry has found the widest application, we consider it in the greatest detail.
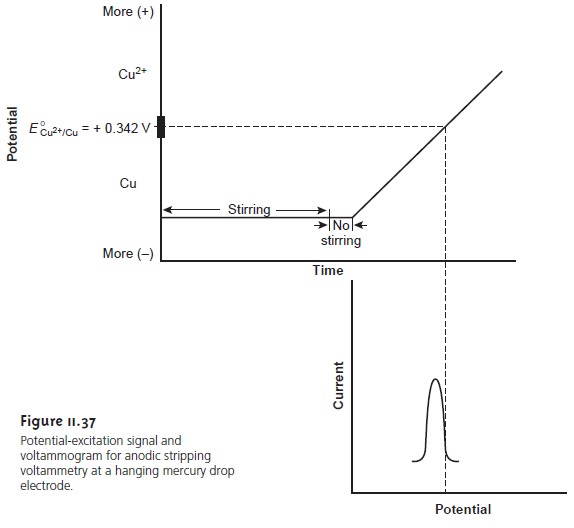
Anodic stripping voltammetry consists of two steps (Figure
11.37). The first
is a controlled potential electrolysis in which
the working electrode, usually a hanging mercury drop or mercury
film, is held at a cathodic potential sufficient to deposit the metal ion on the electrode. For example, with Cu2+ the deposition reaction is
Cu2+(aq)+ 2e– < = = = = > Cu(Hg)
where Cu(Hg) indicates that the copper
is amalgamated with
the mercury. This
step essentially serves as a means
of preconcentrating the analyte from the larger
volume of the solution
to the smaller volume of the electrode. The solution is stirred during electrolysis to increase the
rate of deposition. Near the end
of the deposition time stirring is stopped,
eliminating convection as a mode of mass transport. Deposition times of 1–30 min
are common, with
longer times being
used for analytes at lower
concentrations.
In the second
step, the potential is scanned anodically toward more positive potentials. When the potential of the working
electrode is sufficiently positive the analyte is stripped from
the electrode, returning to solution as its oxidized form
Cu(Hg) < = = = = > Cu2+(aq)+ 2e–
The current during
the stripping step is monitored as a function
of potential, giving rise to peak-shaped voltammograms similar to that
shown in Figure
11.37. The peak current
is proportional to the analyte’s concentration in the solution.
Anodic stripping voltammetry is very sensitive to experimental conditions, which must be carefully controlled if results
are to be accurate and
precise. Key vari- ables include the area
of the mercury
film electrode or the size
of the Hg drop when using a hanging mercury
drop electrode, the deposition time, the rest time, the rate
of stirring, and the scan rate during the stripping
step. Anodic stripping
voltamme- try is best used for metals that form amalgams
with mercury, several
examples of which are listed in Table 11.11.
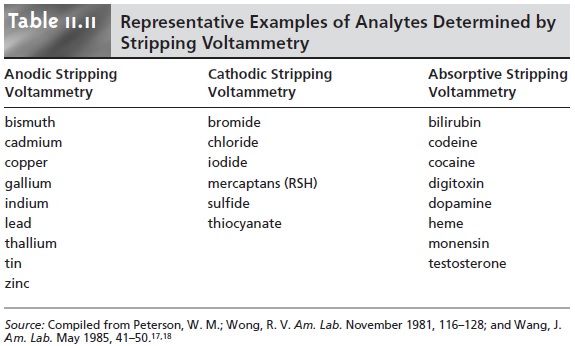
The experimental design for cathodic stripping voltammetry is similar to that for anodic stripping voltammetry with two exceptions.
|
2 |
First, the deposition step involves the oxidation of the Hg electrode to Hg 2+,
which then reacts
with the analyte to form an insoluble film at the surface of the electrode. For example, when Cl– is the analyte the deposition step is
2Hg(l) + 2Cl–(aq)
< = = = = > Hg2Cl2(s)+ 2e–
|
2 |
Hg2Cl2(s)+ 2e– < = = = = > 2Hg(l) + 2Cl–(aq)
Table 11.11 lists several analytes
that have been analyzed successfully by cathodic stripping voltammetry.
In adsorptive stripping voltammetry the deposition step occurs
without elec- trolysis. Instead, the analyte adsorbs
to the electrode’s surface. During deposition
the electrode is maintained at a potential
that enhances adsorption. For example,
adsorption of a neutral molecule
on a Hg drop is enhanced if the electrode is held at –0.4 V versus the
SCE, a potential at which the
surface charge of mercury is approx-
imately zero. When deposition is complete the potential is scanned in an anodic or
cathodic direction depending on whether we wish to oxidize or reduce the analyte.
Examples of compounds that have been analyzed by absorptive stripping voltam- metry also are listed
in Table 11.11.
Amperometry
The final
voltammetric technique to be considered is amperome- try, in which a constant potential
is applied to the working
electrode, and current
is measured as a function of time. Since
the potential is not scanned, amperometry does not lead to a voltammogram.
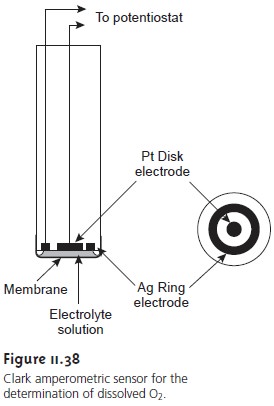
One important application of amperometry is in the construction
of chemical sensors. One of the first amperometric sensors to be developed was for dissolved O2 in blood, which
was developed in 1956 by L. C. Clark. The
design of the
amper- ometric sensor is shown in Figure 11.38
and is similar to potentiometric mem- brane electrodes. A gas-permeable membrane is stretched across
the end of the
sensor and is separated from the working
and counter electrodes by a thin solution
of KCl. The working electrode is a Pt disk cathode,
and an Ag ring anode
is the counter electrode.
Although several gases can diffuse across the membrane, including O2,
N2, and CO2, only oxygen is reduced at the cathode.
O2(aq)+ 4H3O+(aq)+ 4e– < =
= = = > 6H2O(l)
Another example of an amperometric sensor is the glucose sensor.
In this case the single membrane
in Figure 11.38 is replaced
with three membranes. The outermost membrane is of polycarbonate, which is permeable
to glucose and O2. The second membrane contains an immobilized preparation of glu- cose oxidase that catalyzes
the oxidation of glucose to gluconolactone and hy-
drogen peroxide.
β-D-glucose(aq)+ O2(g) + H2O(l)
< = = = = > gluconolactone(aq)+ H2O2(aq)
The hydrogen peroxide
then diffuses through
the innermost membrane
of cel- lulose acetate,
where it is oxidized at a Pt anode.
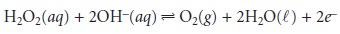
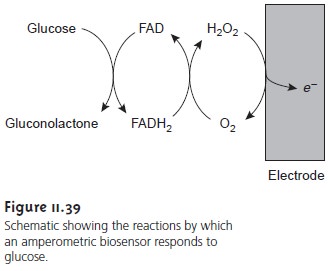
Figure 11.39 summarizes the reactions taking
place in this
amperometric sen- sor. FAD
is the oxidized form of flavin
adenine nucleotide (the
active site of the
enzyme glucose oxidase), and FADH2 is the active
site’s reduced form. Note that O2 serves
as a mediator, carrying electrons to the electrode. Other mediators, such as Fe(CN) 63–,
can be used in place
of O2.
By changing the
enzyme and mediator, the amperometric sen- sor in Figure 11.39 is easily extended to the analysis
of other sub- strates. Other bioselective materials may be incorporated into am- perometric sensors. For example, a CO2 sensor
has been developed using an amperometric O2 sensor with a two-layer membrane, one of which
contains an immobilized preparation of autotrophic bacteria. As CO2 diffuses through the membranes, it is converted to O2 by the bacteria, increasing the concentration of O2 at the Pt cathode
.
Related Topics